Bristol City Council elections
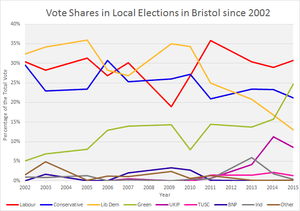
Local Election Vote Share in Bristol since 2002
.png)
Political Make-up of Bristol City Council since 2002
Bristol is a unitary authority and ceremonial county in England. Until 1 April 1996 it was a non-metropolitan district in Avon. Since 2012 it has also had a directly elected mayor.
Political control
Directly elected mayor
| Party in control | Years | |
|---|---|---|
| Independent | 2012-2016 | |
| Labour | 2016–present | |
City council
Since the first election to the council in 1973 political control of the council has been held by the following parties:[1]
Non-metropolitan district
| Party in control | Years | |
|---|---|---|
| Labour | 1973-1983 | |
| No overall control | 1983-1986 | |
| Labour | 1986-1996 | |
Unitary authority
| Party in control | Years | |
|---|---|---|
| Labour | 1995-2003 | |
| No overall control | 2003-2009 | |
| Liberal Democrats | 2009-2011 | |
| No overall control | 2011-2016 | |
| Labour | 2016–present | |
Current councillors
| Party | Councillors | |
|---|---|---|
| Labour | 37 | |
| Conservative | 14 | |
| Green | 11 | |
| Liberal Democrats | 8 | |
| Ward | Party | Councillor | |
|---|---|---|---|
| Ashley | Green | Jude English | |
| Ashley | Labour | Mike Davies | |
| Ashley | Labour | Carole Johnson | |
| Avonmouth & Lawrence Weston | Labour | Donald Alexander | |
| Avonmouth & Lawrence Weston | Conservative | Matt Melias | |
| Avonmouth & Lawrence Weston | Labour | Jo Sargeant | |
| Bedminster | Labour | Celia Phipps | |
| Bedminster | Labour | Mark Bradshaw | |
| Bishopston & Ashley Down | Labour | Tom Brook | |
| Bishopston & Ashley Down | Green | Eleanor Combley | |
| Bishopsworth | Conservative | Richard Eddy | |
| Bishopsworth | Conservative | Kevin Quarterly | |
| Brislington East | Conservative | Tony Carey | |
| Brislington East | Labour | Mike Langley | |
| Brislington West | Labour | Harriet Bradley | |
| Brislington West | Liberal Democrats | Jos Clark | |
| Bristol Central | Labour | Kye Dudd | |
| Bristol Central | Labour | Paul Smith | |
| Clifton | Green | Paula O'Rourke | |
| Clifton | Green | Jerome Thomas | |
| Clifton Down | Green | Carla Denyer | |
| Clifton Down | Green | Clive Stevens | |
| Cotham | Green | Cleo Lake | |
| Cotham | Liberal Democrats | Anthony Negus | |
| Easton | Labour | Ruth Pickersgill | |
| Easton | Labour | Afzal Shah | |
| Eastville | Labour | Mahmadur Khan | |
| Eastville | Labour | Mhairi Threlfall | |
| Filwood | Labour | Chris Jackson | |
| Filwood | Labour | Jeff Lovell | |
| Frome Vale | Conservative | Lesley Alexander | |
| Frome Vale | Labour | Nicola Bowden-Jones | |
| Hartcliffe & Withywood | Labour | Mark Brain | |
| Hartcliffe & Withywood | Labour | Helen Legg | |
| Hartcliffe & Withywood | Labour | Paul Goggin | |
| Henbury & Brentry | Conservative | Chris Windows | |
| Henbury & Brentry | Conservative | Mark Weston | |
| Hengrove & Whitchurch Park | Liberal Democrats | Tim Kent | |
| Hengrove & Whitchurch Park | Liberal Democrats | Harriet Clough | |
| Hengrove & Whitchurch Park | Labour | Barry Clark | |
| Hillfields | Labour | Craig Cheney | |
| Hillfields | Labour | Anna Keen | |
| Horfield | Conservative | Claire Hiscott | |
| Horfield | Labour | Olly Mead | |
| Hotwells & Harbourside | Liberal Democrats | Mark Wright | |
| Knowle | Liberal Democrats | Chris Davies | |
| Knowle | Liberal Democrats | Gary Hopkins | |
| Lawrence Hill | Labour | Marg Hickman | |
| Lawrence Hill | Labour | Hibaq Jama | |
| Lockleaze | Labour | Gill Kirk | |
| Lockleaze | Labour | Estella Tincknell | |
| Redland | Green | Martin Fodor | |
| Redland | Green | Fi Hance | |
| Southmead | Labour | Brenda Massey | |
| Southmead | Labour | Helen Teige | |
| Southville | Green | Charlie Bolton | |
| Southville | Green | Stephen Clarke | |
| St George Central | Labour | Nicola Beech | |
| St George Central | Labour | Steve Pearce | |
| St George Troopers Hill | Labour | Fabian Breckels | |
| St George West | Labour | Asher Craig | |
| Stockwood | Conservative | Steve Jones | |
| Stockwood | Conservative | Graham Morris | |
| Stoke Bishop | Conservative | Peter Abraham | |
| Stoke Bishop | Conservative | John Goulandris | |
| Westbury-on-Trym & Henleaze | Liberal Democrats | Clare Campion-Smith | |
| Westbury-on-Trym & Henleaze | Conservative | Geoff Gollop | |
| Westbury-on-Trym & Henleaze | Conservative | Liz Radford | |
| Windmill Hill | Labour | Jon Wellington | |
| Windmill Hill | Labour | Lucy Whittle | |
Mayoral elections
By-election results
| Party | Candidate | Votes | % | ± | |
|---|---|---|---|---|---|
| Liberal Democrat | Jacqueline Edna Norman | 1,453 | 52.5 | +11.6 | |
| Labour | Jane Veronica Painter | 1,002 | 36.2 | -0.6 | |
| Conservative | Robert Andrew Britton | 310 | 11.2 | -8.6 | |
| Green | Mary Beryl Wood | 47 | 1.7 | ||
| Socialist Labour | Paul Francis Williams | 16 | 0.6 | ||
| Majority | 451 | 16.3 | |||
| Turnout | 2,765 | 32.0 | |||
| Liberal Democrat gain from Labour | Swing | +6.1 | |||
| Party | Candidate | Votes | % | ± | |
|---|---|---|---|---|---|
| Liberal Democrat | Anne White | 1,035 | 59.4 | +18.0 | |
| Labour | Alison Claire Wilson | 392 | 22.5 | -12.6 | |
| Conservative | Ashley Peter Fox | 250 | 14.4 | -1.0 | |
| Green | Charles Nicholas Bolton | 65 | 3.7 | -4.5 | |
| Socialist Labour | Kay Sandra Carter | 59 | 3.4 | +3.4 | |
| Majority | 643 | 36.9 | |||
| Turnout | 1,801 | 17.1 | |||
| Liberal Democrat hold | Swing | +15.3 | |||
| Party | Candidate | Votes | % | ± | |
|---|---|---|---|---|---|
| Liberal Democrat | Trevor Ernest Riddlestone | 812 | 38.6 | +24.6 | |
| Labour | Raymond John Sefia | 694 | 33.0 | -29.9 | |
| Socialist Labour | Bernard Joseph Kennedy | 263 | 12.5 | +12.5 | |
| Green | David Mark Simpson | 222 | 10.6 | -4.6 | |
| Conservative | Richard Jonathan Chambers | 111 | 5.3 | -2.7 | |
| Majority | 118 | 5.6 | |||
| Turnout | 2,102 | 25.8 | |||
| Liberal Democrat gain from Labour | Swing | +27.3 | |||
| Party | Candidate | Votes | % | ± | |
|---|---|---|---|---|---|
| Liberal Democrat | Sean Emmett | 1,288 | 52.4 | +28.7 | |
| Labour | Kathleen Rosalie Walker | 888 | 36.1 | -12.7 | |
| Conservative | Lewis William Price | 283 | 11.5 | -9.8 | |
| Majority | 400 | 16.3 | |||
| Turnout | 2,459 | 30.9 | |||
| Liberal Democrat gain from Labour | Swing | +20.7 | |||
| Party | Candidate | Votes | % | ± | |
|---|---|---|---|---|---|
| Labour | Josephine Hargreaves | 1,415 | 43.7 | -8.6 | |
| Liberal Democrat | Jon Freeman | 1,076 | 33.2 | +17.0 | |
| Conservative | Philip Arthur Cobbold | 529 | 16.3 | -0.8 | |
| Green | Charles Nicholas Bolton | 160 | 4.9 | -7.1 | |
| Socialist Alliance | Peter Henry Wearden | 58 | 1.8 | -0.6 | |
| Majority | 339 | 10.5 | |||
| Turnout | 3,238 | 39.8 | |||
| Labour hold | Swing | -12.8 | |||
| Party | Candidate | Votes | % | ± | |
|---|---|---|---|---|---|
| Liberal Democrat | Sue O'Donnell | 961 | 41.2 | -5.1 | |
| Labour | Diane Elizabeth Bunyan | 879 | 37.7 | +2.6 | |
| Conservative | Seva Singh | 148 | 6.4 | +0.4 | |
| Bristolian | Julien George Weston | 127 | 5.5 | -3.2 | |
| Green | Michael Crawford | 127 | 5.5 | +1.6 | |
| UKIP | Ilse Elisabeth Temple | 88 | 3.8 | +3.8 | |
| Majority | 82 | 3.5 | |||
| Turnout | 2,330 | 28.0 | |||
| Liberal Democrat hold | Swing | -3.9 | |||
| Party | Candidate | Votes | % | ± | |
|---|---|---|---|---|---|
| Liberal Democrat | Tony Potter | 924 | 34.0 | +9.1 | |
| Labour | Kevin Herniman | 816 | 30.1 | -8.1 | |
| Conservative | Colin Bretherton | 509 | 18.8 | -18.1 | |
| Independent | Angelo Agathangelou | 257 | 9.5 | +9.5 | |
| Green | Nick Foster | 116 | 4.3 | +4.3 | |
| English Democrat | Michael Blundell | 93 | 3.4 | +3.4 | |
| Majority | 107 | 3.9 | |||
| Turnout | 2,720 | 32.9 | |||
| Liberal Democrat gain from Labour | Swing | 8.6 | |||
| Party | Candidate | Votes | % | ± | |
|---|---|---|---|---|---|
| Labour | Brenda Massey | 1,109 | 45.5 | +14.1 | |
| Conservative | Ronda Brace | 765 | 31.4 | +12.5 | |
| Liberal Democrat | Barry Cash | 365 | 15.0 | -17.1 | |
| Green | Chris Millman | 120 | 4.9 | -1.3 | |
| English Democrat | Stephen Wright | 77 | 3.2 | -8.3 | |
| Majority | 344 | ||||
| Turnout | 2,443 | 28.6 | |||
| Labour gain from Liberal Democrat | Swing | ||||
References
- ↑ "Council compositions". The Elections Centre. Retrieved 3 May 2016.
- ↑ "Bristol City Council Election Results for 17 Jun 1997". Bristol City Council. Retrieved 2009-09-17.
- ↑ "Bristol City Council Election Results for 12 Mar 1998". Bristol City Council. Retrieved 2009-09-17.
- ↑ "Bristol City Council Election Results for 18 Jun 1998". Bristol City Council. Retrieved 2009-09-17.
- ↑ "Bristol City Council Election Results for 10 Feb 2000". Bristol City Council. Retrieved 2009-09-17.
- ↑ "Bristol City Council Election Results for 19 Oct 2000". Bristol City Council. Retrieved 2009-09-17.
- ↑ "Bristol City Council Election Results for 20 May 2004". Bristol City Council. Retrieved 2009-09-17.
- ↑ "Bristol City Council Election Results for 9 Oct 2008". Bristol City Council. Retrieved 2009-09-17.
External links
| Bristol City Council | |
|---|---|
| Avon County Council |
|
| |
This article is issued from Wikipedia - version of the 8/6/2016. The text is available under the Creative Commons Attribution/Share Alike but additional terms may apply for the media files.