California's 12th congressional district
| California's 12th congressional district | ||
|---|---|---|
.tif.png) | ||
| Current Representative | Nancy Pelosi (D–San Francisco) | |
| Distribution | 100.0% urban, 0.0% rural | |
| Median income | $48,523[1] | |
| Ethnicity | 44.0% White, 6.3% Black, 33.4% Asian, 14.7% Hispanic, 1.7[2]% other | |
| Cook PVI | D+34 | |
California's 12th congressional district is a congressional district in the U.S. state of California.
House Minority Leader Nancy Pelosi, a Democrat, has represented the district since January 2013.
Currently, the 12th district is entirely within the city of San Francisco.[3]
Prior to redistricting by the California Citizens Redistricting Commission of 2011, the 12th district consisted of portions of both San Mateo County and San Francisco.
History
When the 12th Congressional District was created after the 1930 Census, it was located in Los Angeles County. As California's population grew, however, the district generally shrank in area and progressed northward, eventually reaching the San Francisco peninsula (California political districts are generally numbered from north to south[4]).
Richard Nixon, the 37th President of the United States, represented this district from 1947-1951. Nancy Pelosi, the 60th Speaker of the House, is the current representative of this district.
Recent election results from statewide races
| Year | Office | Results |
|---|---|---|
| 1992 | U.S. President | Clinton 58 - 27% |
| U.S. Senator | Boxer 62 - 31% | |
| U.S. Senator | Feinstein 70 - 26% | |
| 1994 | Governor | Brown 53 - 44% |
| U.S. Senator | Feinstein 67 - 27% | |
| 1996 | U.S. President | Clinton 70 - 21% |
| 1998 | Governor | [Data unknown/missing. You can help!] |
| U.S. Senator | [Data unknown/missing. You can help!] | |
| 2000 | U.S. President[5] | Gore 67 - 27% |
| U.S. Senator[6] | Feinstein 68 - 25% | |
| 2002 | Governor[7] | Davis 60 - 27% |
| 2003 | Governor's Recall[8][9] | No 66 - 34% |
| Bustamante 47 - 32% | ||
| 2004 | U.S. President[10] | Kerry 72 - 27% |
| U.S. Senator[11] | Boxer 73 - 24% | |
| 2006 | Governor[12] | Angelides 51 - 44% |
| U.S. Senator[13] | Feinstein 77 - 18% | |
| 2008 | U.S. President[14] | Obama 74 - 24% |
| 2010 | Governor | Brown 68 - 29% |
| U.S. Senator | Boxer 68 - 28% | |
| 2012 | U.S. President[15] | Obama 84 - 13% |
| 2016 | U.S. President[16] | Clinton 85 - 10% |
| U.S. Senator[17] | Harris 78 - 22% |
List of representatives
| Representative | Party | Dates | Notes | Counties[18][19][20] |
|---|---|---|---|---|
| District created | March 4, 1933 | |||
 John H. Hoeppel John H. Hoeppel |
Democratic | March 4, 1933 – January 3, 1937 |
Lost re-nomination | Eastern Los Angeles |
rev.jpg) Jerry Voorhis Jerry Voorhis |
Democratic | January 3, 1937 – January 3, 1947 |
Lost re-election | |
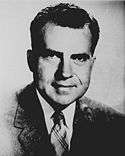 Richard Nixon Richard Nixon |
Republican | January 3, 1947 – November 30, 1950 |
Elected to the Senate | |
| Vacant | November 30, 1950 – January 3, 1951 | |||
 Patrick J. Hillings Patrick J. Hillings |
Republican | January 3, 1951 – January 3, 1953 |
Redistricted to the 25th district | |
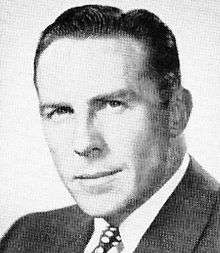
| Allan O. Hunter |
Republican | January 3, 1953 – January 3, 1955 |
Redistricted from the 9th district Lost re-election |
Fresno, Madera, Merced |
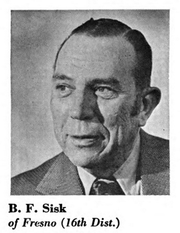 Bernice F. Sisk Bernice F. Sisk |
Democratic | January 3, 1955 – January 3, 1963 |
Redistricted to the 16th district | |
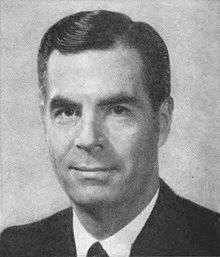 Burt L. Talcott Burt L. Talcott |
Republican | January 3, 1963 – January 3, 1967 |
Monterey, San Benito, San Luis Obispo, Santa Cruz | |
| January 3, 1967 – January 3, 1973 |
Kings, Monterey, San Luis Obispo, Santa Cruz | |||
| January 3, 1973 – January 3, 1975 |
Redistricted to the 16th district | Monterey, San Benito, northwestern San Luis Obispo, southern Santa Clara, Santa Cruz | ||
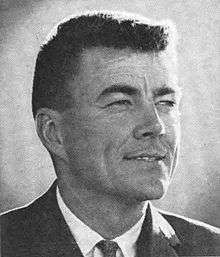 Pete McCloskey Pete McCloskey |
Republican | January 3, 1975 – January 3, 1983 |
Redistricted from the 17th district Retired to run for US Senate |
Southern San Mateo, northern Santa Clara |
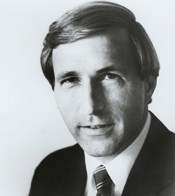 Ed Zschau Ed Zschau |
Republican | January 3, 1983 – January 3, 1987 |
Retired to run for US Senate | Southern San Mateo, Santa Clara, northern Santa Cruz |
 Ernie Konnyu Ernie Konnyu |
Republican | January 3, 1987 – January 3, 1989 |
Lost re-nomination | |
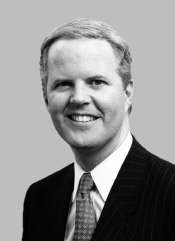 Tom Campbell Tom Campbell |
Republican | January 3, 1989 – January 3, 1993 |
Retired to run for US Senate | |
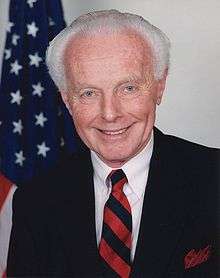 Tom Lantos Tom Lantos |
Democratic | January 3, 1993 – February 11, 2008 |
Redistricted from the 11th district Died |
Southwestern San Francisco, northern San Mateo |
Southwestern San Francisco, northern San Mateo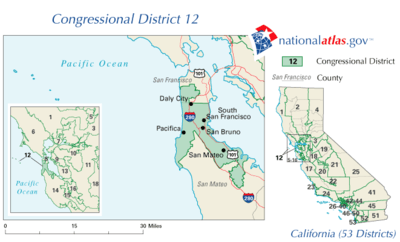 | ||||
| Vacant | February 11, 2008 – April 8, 2008 |
|||
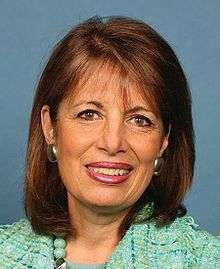 Jackie Speier Jackie Speier |
Democratic | April 8, 2008 – January 3, 2013 |
Redistricted to the 14th district | |
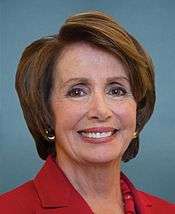 Nancy Pelosi Nancy Pelosi |
Democratic | January 3, 2013 – present |
Redistricted from the 8th district | most of San Francisco |
Election results
|
1932 • 1934 • 1936 • 1938 • 1940 • 1942 • 1944 • 1946 • 1948 • 1950 • 1952 • 1954 • 1956 • 1958 • 1960 • 1962 • 1964 • 1966 • 1968 • 1970 • 1972 • 1974 • 1976 • 1978 • 1980 • 1982 • 1984 • 1986 • 1988 • 1990 • 1992 • 1994 • 1996 • 1998 • 2000 • 2002 • 2004 • 2006 • 2008 • 2010 • 2012 • 2014 |
1932
| Party | Candidate | Votes | % | ||
|---|---|---|---|---|---|
| Democratic | John H. Hoeppel | 43,122 | 45.8 | ||
| Republican | Frederick F. Houser | 40,674 | 43.2 | ||
| Prohibition | Richard M. Cannon | 10,308 | 11.0 | ||
| Total votes | 94,104 | 100.0 | |||
| Voter turnout | % | ||||
| Democratic win (new seat) | |||||
1934
| Party | Candidate | Votes | % | |
|---|---|---|---|---|
| Democratic | John H. Hoeppel (incumbent) | 52,595 | 50.7 | |
| Republican | Frederick F. Houser | 51,216 | 49.3 | |
| Total votes | 103,811 | 100.0 | ||
| Voter turnout | % | |||
| Democratic hold | ||||
1936
| Party | Candidate | Votes | % | |
|---|---|---|---|---|
| Democratic | Jerry Voorhis | 62,034 | 53.7 | |
| Republican | Frederick F. Houser | 53,445 | 46.3 | |
| Total votes | 115,479 | 100.0 | ||
| Voter turnout | % | |||
| Democratic hold | ||||
1938
| Party | Candidate | Votes | % | |
|---|---|---|---|---|
| Democratic | Jerry Voorhis (incumbent) | 75,003 | 60.8 | |
| Republican | Eugene W. Nixon | 40,457 | 32.8 | |
| Townsend | Russell R. Hand | 7,903 | 6.4 | |
| Total votes | 123,363 | 100.0 | ||
| Voter turnout | % | |||
| Democratic hold | ||||
1940
| Party | Candidate | Votes | % | |
|---|---|---|---|---|
| Democratic | Jerry Voorhis (incumbent) | 99,494 | 64.0 | |
| Republican | Eugene W. Nixon | 54,731 | 35.2 | |
| Communist | Albert Lewis | 1,152 | 0.8 | |
| Total votes | 155,377 | 100.0 | ||
| Voter turnout | % | |||
| Democratic hold | ||||
1942
| Party | Candidate | Votes | % | |
|---|---|---|---|---|
| Democratic | Jerry Voorhis (incumbent) | 53,705 | 56.8 | |
| Republican | Robert P. Shuler | 40,780 | 43.2 | |
| Total votes | 94,485 | 100.0 | ||
| Voter turnout | % | |||
| Democratic hold | ||||
1944
| Party | Candidate | Votes | % | |
|---|---|---|---|---|
| Democratic | Jerry Voorhis (incumbent) | 77,385 | 55.3 | |
| Republican | Roy P. McLaughlin | 62,524 | 44.7 | |
| Total votes | 139,909 | 100.0 | ||
| Voter turnout | % | |||
| Democratic hold | ||||
1946
| Party | Candidate | Votes | % | |||
|---|---|---|---|---|---|---|
| Republican | Richard Nixon | 65,586 | 56.0 | |||
| Democratic | Jerry Voorhis (incumbent) | 49,994 | 42.7 | |||
| Prohibition | John Henry Hoeppel | 1,476 | 1.3 | |||
| Total votes | 117,056 | 100.0 | ||||
| Voter turnout | % | |||||
| Republican gain from Democratic | ||||||
1948
| Party | Candidate | Votes | % | |
|---|---|---|---|---|
| Republican | Richard Nixon (incumbent) | 141,509 | 87.8 | |
| Progressive | Una W. Rice | 19,631 | 12.2 | |
| Total votes | 161,140 | 100.0 | ||
| Voter turnout | % | |||
| Republican hold | ||||
1950
| Party | Candidate | Votes | % | |
|---|---|---|---|---|
| Republican | Patrick J. Hillings | 107,933 | 60.1 | |
| Democratic | Steve Zetterberg | 71,682 | 39.9 | |
| Total votes | 179,615 | 100.0 | ||
| Voter turnout | % | |||
| Republican hold | ||||
1952
| Party | Candidate | Votes | % | |
|---|---|---|---|---|
| Republican | Allan O. Hunter (incumbent) | 103,587 | 100.0 | |
| Voter turnout | % | |||
| Republican hold | ||||
1954
| Party | Candidate | Votes | % | |||
|---|---|---|---|---|---|---|
| Democratic | Bernice F. Sisk | 63,911 | 53.8 | |||
| Republican | Allan O. Hunter (incumbent) | 54,903 | 46.2 | |||
| Total votes | 118,814 | 100.0 | ||||
| Voter turnout | % | |||||
| Democratic gain from Republican | ||||||
1956
| Party | Candidate | Votes | % | |
|---|---|---|---|---|
| Democratic | Bernice F. Sisk (incumbent) | 109,920 | 73 | |
| Republican | Robert B. Moore | 40,663 | 27 | |
| Total votes | 150,583 | 100 | ||
| Voter turnout | % | |||
| Democratic hold | ||||
1958
| Party | Candidate | Votes | % | |
|---|---|---|---|---|
| Democratic | Bernice F. Sisk (incumbent) | 112,702 | 81.1 | |
| Republican | Daniel K. Halpin | 26,228 | 18.9 | |
| Total votes | 138,930 | 100 | ||
| Voter turnout | % | |||
| Democratic hold | ||||
1960
| Party | Candidate | Votes | % | |
|---|---|---|---|---|
| Democratic | Bernice F. Sisk (incumbent) | 141,974 | 100.0 | |
| Voter turnout | % | |||
| Democratic hold | ||||
1962
| Party | Candidate | Votes | % | ||
|---|---|---|---|---|---|
| Republican | Burt L. Talcott (incumbent) | 75,424 | 61.3 | ||
| Democratic | William K. Steward | 47,576 | 38.7 | ||
| Total votes | 123,000 | 100.0 | |||
| Voter turnout | % | ||||
| Republican win (new seat) | |||||
1964
| Party | Candidate | Votes | % | |
|---|---|---|---|---|
| Republican | Burt L. Talcott (incumbent) | 93,112 | 61.9 | |
| Democratic | William K. Steward | 57,242 | 38.1 | |
| Total votes | 150,354 | 100.0 | ||
| Voter turnout | % | |||
| Republican hold | ||||
1966
| Party | Candidate | Votes | % | |
|---|---|---|---|---|
| Republican | Burt L. Talcott (incumbent) | 108,070 | 77.3 | |
| Democratic | Gerald V. Barron | 31,787 | 22.7 | |
| Total votes | 139,857 | 100.0 | ||
| Voter turnout | % | |||
| Republican hold | ||||
1968
| Party | Candidate | Votes | % | |
|---|---|---|---|---|
| Republican | Burt L. Talcott (incumbent) | 140,713 | 94.9 | |
| American Independent | Ann J. Holliday | 7,593 | 5.1 | |
| Total votes | 148,308 | 100.0 | ||
| Voter turnout | % | |||
| Republican hold | ||||
1970
| Party | Candidate | Votes | % | |
|---|---|---|---|---|
| Republican | Burt L. Talcott (incumbent) | 95,549 | 63.6 | |
| Democratic | O'Brien Riordan | 50,942 | 33.9 | |
| Peace and Freedom | Herbert H. Foster, Jr. | 3,682 | 2.5 | |
| Total votes | 150,173 | 100.0 | ||
| Voter turnout | % | |||
| Republican hold | ||||
1972
| Party | Candidate | Votes | % | |
|---|---|---|---|---|
| Republican | Burt L. Talcott (incumbent) | 105,555 | 54.0 | |
| Democratic | Julian Camacho | 84,268 | 43.1 | |
| American Independent | Stanley K. Monteith | 5,753 | 2.9 | |
| Total votes | 195,576 | 100.0 | ||
| Voter turnout | % | |||
| Republican hold | ||||
1974
| Party | Candidate | Votes | % | |
|---|---|---|---|---|
| Republican | Pete McCloskey (incumbent) | 103,228 | 69.1 | |
| Democratic | Gary G. Gillmor | 46,197 | 30.9 | |
| Total votes | 149,425 | 100.0 | ||
| Voter turnout | % | |||
| Republican hold | ||||
1976
| Party | Candidate | Votes | % | |
|---|---|---|---|---|
| Republican | Pete McCloskey (incumbent) | 130,332 | 66.2 | |
| Democratic | David T. Harris | 61,526 | 31.3 | |
| American Independent | Joseph David "Joss" Cooney | 4,999 | 2.5 | |
| Total votes | 196,857 | 100.0 | ||
| Voter turnout | % | |||
| Republican hold | ||||
1978
| Party | Candidate | Votes | % | |
|---|---|---|---|---|
| Republican | Pete McCloskey (incumbent) | 116,982 | 73.1 | |
| Democratic | Kirsten Olsen | 34,472 | 21.5 | |
| American Independent | Harold R. Boylan | 5,609 | 3.5 | |
| Peace and Freedom | Adele Fumino | 3,022 | 1.9 | |
| Total votes | 160,085 | 100.0 | ||
| Voter turnout | % | |||
| Republican hold | ||||
1980
| Party | Candidate | Votes | % | |
|---|---|---|---|---|
| Republican | Pete McCloskey (incumbent) | 143,817 | 72.2 | |
| Democratic | Kirsten Olsen | 37,009 | 18.6 | |
| Libertarian | Bill Evers | 15,073 | 7.6 | |
| Peace and Freedom | Adele Fumino | 3,184 | 1.6 | |
| Total votes | 199,083 | 100.0 | ||
| Voter turnout | % | |||
| Republican hold | ||||
1982
| Party | Candidate | Votes | % | |
|---|---|---|---|---|
| Republican | Ed Zschau | 115,365 | 63.0 | |
| Democratic | Emmett Lynch | 61,372 | 33.5 | |
| Libertarian | William C. "Bill" White | 6,471 | 3.5 | |
| Total votes | 183,208 | 100.0 | ||
| Voter turnout | % | |||
| Republican hold | ||||
1984
| Party | Candidate | Votes | % | |
|---|---|---|---|---|
| Republican | Ed Zschau (incumbent) | 155,795 | 61.7 | |
| Democratic | Martin Carnoy | 91,026 | 36.0 | |
| Libertarian | William C. "Bill" White | 5,872 | 2.3 | |
| Total votes | 252,963 | 100.0 | ||
| Voter turnout | % | |||
| Republican hold | ||||
1986
| Party | Candidate | Votes | % | |
|---|---|---|---|---|
| Republican | Ernie Konnyu | 111,252 | 59.5 | |
| Democratic | Lance T. Weil | 69,564 | 37.2 | |
| Libertarian | William C. "Bill" White | 6,227 | 3.3 | |
| Total votes | 187,043 | 100.0 | ||
| Voter turnout | % | |||
| Republican hold | ||||
1988
| Party | Candidate | Votes | % | |
|---|---|---|---|---|
| Republican | Tom Campbell | 136,384 | 51.7 | |
| Democratic | Anna Eshoo | 121,523 | 46.0 | |
| Libertarian | Tom Grey | 6,023 | 2.3 | |
| Total votes | 263,930 | 100.0 | ||
| Voter turnout | % | |||
| Republican hold | ||||
1990
| Party | Candidate | Votes | % | |
|---|---|---|---|---|
| Republican | Tom Campbell (incumbent) | 125,157 | 60.8 | |
| Democratic | Bob Palmer | 69,270 | 33.7 | |
| Libertarian | Chuck Olson | 11,271 | 5.5 | |
| Total votes | 205,698 | 100.0 | ||
| Voter turnout | % | |||
| Republican hold | ||||
1992
| Party | Candidate | Votes | % | |
|---|---|---|---|---|
| Democratic | Tom Lantos (incumbent) | 157,205 | 68.8 | |
| Republican | Jim R. Tomlin | 53,278 | 23.3 | |
| Peace and Freedom | Mary Weldon | 10,142 | 4.4 | |
| Libertarian | George L. O'Brien | 7,782 | 3.4 | |
| Total votes | 228,407 | 100.0 | ||
| Voter turnout | % | |||
| Democratic hold | ||||
1994
| Party | Candidate | Votes | % | |
|---|---|---|---|---|
| Democratic | Tom Lantos (incumbent) | 118,408 | 67.42 | |
| Republican | Deborah Wilder | 57,228 | 32.58 | |
| Total votes | 175,636 | 100.0 | ||
| Voter turnout | % | |||
| Democratic hold | ||||
1996
| Party | Candidate | Votes | % | |
|---|---|---|---|---|
| Democratic | Tom Lantos (incumbent) | 149,052 | 71.7 | |
| Republican | Storm Jenkins | 49,278 | 23.8 | |
| Libertarian | Christopher Schmidt | 6,111 | 2.9 | |
| Natural Law | Richard Bong | 3,472 | 1.6 | |
| Total votes | 207,913 | 100.0 | ||
| Voter turnout | % | |||
| Democratic hold | ||||
1998
| Party | Candidate | Votes | % | |
|---|---|---|---|---|
| Democratic | Tom Lantos (incumbent) | 128,135 | 73.98 | |
| Republican | Robert H. Evans, Jr. | 36,562 | 21.11 | |
| Libertarian | Michael J. Moloney | 8,515 | 4.92 | |
| Total votes | 173,212 | 100.0 | ||
| Voter turnout | % | |||
| Democratic hold | ||||
2000
| Party | Candidate | Votes | % | |
|---|---|---|---|---|
| Democratic | Tom Lantos (incumbent) | 158,404 | 74.6 | |
| Republican | Mike Garza | 44,162 | 20.8 | |
| Libertarian | Barbara J. Less | 6,431 | 3.0 | |
| Natural Law | Rifkin Young | 3,559 | 1.6 | |
| Total votes | 212,556 | 100.0 | ||
| Voter turnout | % | |||
| Democratic hold | ||||
2002
| Party | Candidate | Votes | % | |
|---|---|---|---|---|
| Democratic | Tom Lantos (incumbent) | 105,597 | 68.1 | |
| Republican | Michael J. Moloney | 38,381 | 24.8 | |
| Libertarian | Maad Abu-Ghazalah | 11,006 | 7.1 | |
| Total votes | 185,216 | 100.0 | ||
| Voter turnout | % | |||
| Democratic hold | ||||
2004
| Party | Candidate | Votes | % | |
|---|---|---|---|---|
| Democratic | Tom Lantos (incumbent) | 171,852 | 68.1 | |
| Republican | Mike Garza | 52,593 | 20.8 | |
| Green | Pat Green | 23,038 | 9.1 | |
| Libertarian | Harland Harrison | 5,116 | 2.0 | |
| Total votes | 252,599 | 100.0 | ||
| Voter turnout | % | |||
| Democratic hold | ||||
2006
| Party | Candidate | Votes | % | |
|---|---|---|---|---|
| Democratic | Tom Lantos (incumbent) | 138,650 | 76.1 | |
| Republican | Mike Moloney | 43,674 | 23.9 | |
| Total votes | 182,324 | 100.0 | ||
| Voter turnout | % | |||
| Democratic hold | ||||
2008 (Special)
| Party | Candidate | Votes | % | |
|---|---|---|---|---|
| Democratic | Jackie Speier | 66,279 | 76.90 | |
| Republican | Greg Conlon | 7,990 | 9.27 | |
| Democratic | Michelle McMurry | 4,546 | 5.27 | |
| Republican | Mike Moloney | 4,517 | 5.24 | |
| Green | Barry Hermanson | 1,947 | 2.26 | |
| Libertarian | Kevin Peterson (write-in) | 2 | 0.00 | |
| Invalid or blank votes | 903 | 1.05 | ||
| Total votes | 86,184 | 100.00 | ||
| Voter turnout | 25.69% | |||
| Democratic hold | ||||
2008
| Party | Candidate | Votes | % | |
|---|---|---|---|---|
| Democratic | Jackie Speier (incumbent) | 200,442 | 75.2 | |
| Republican | Greg Conlon | 49,258 | 18.5 | |
| Peace and Freedom | Nathalie Hrizi | 5,793 | 2.2 | |
| Green | Barry Hermanson | 5,776 | 2.1 | |
| Libertarian | Kevin Dempsey Peterson | 5,584 | 2.0 | |
| Total votes | 266,853 | 100 | ||
| Voter turnout | % | |||
| Democratic hold | ||||
2010
| Party | Candidate | Votes | % | |
|---|---|---|---|---|
| Democratic | Jackie Speier (incumbent) | 152,044 | 75.6 | |
| Republican | Mike Moloney | 44,475 | 22.2 | |
| Libertarian | Mark Paul Williams | 4,611 | 2.2 | |
| Independent | Joseph Michael Harding (write-in) | 32 | 0.0 | |
| Total votes | 201,162 | 100 | ||
| Voter turnout | % | |||
| Democratic hold | ||||
2012
| Party | Candidate | Votes | % | |
|---|---|---|---|---|
| Democratic | Nancy Pelosi (incumbent) | 253,709 | 85.1 | |
| Republican | John Dennis | 44,478 | 14.9 | |
| Total votes | 298,187 | 100.0 | ||
| Democratic hold | ||||
2014
| Party | Candidate | Votes | % | |
|---|---|---|---|---|
| Democratic | Nancy Pelosi (incumbent) | 160,067 | 83.3 | |
| Republican | John Dennis | 32,197 | 16.7 | |
| Total votes | 192,264 | 100.0 | ||
| Democratic hold | ||||
Living former Members
As of April 2015, there are five living former members of the House of Representatives from this district.
| Representative | Term in office | Date of birth (and age) |
|---|---|---|
| Pete McCloskey | 1975 - 1983 | September 29, 1927 |
| Ed Zschau | 1983 - 1987 | January 6, 1940 |
| Ernie Konnyu | 1987 - 1989 | May 17, 1937 |
| Tom Campbell | 1989 - 1993 | August 14, 1952 |
| Jackie Speier | 2008 - 2013 | May 14, 1950 |
See also
References
- ↑ http://bigstory.ap.org/article/party-rich-congress-its-democrats
- ↑ "California election results - 2012 election". Los Angeles Times. Retrieved February 24, 2013.
- ↑ "Maps: Final Congressional Districts". Citizens Redistricting Commission. Retrieved February 24, 2013.
- ↑ California Constitution, Article 21, Section 1(c) (congressional districts), Section 2(f) (state government districts).
- ↑ Statement of Vote (2000 President)
- ↑ Statement of Vote (2000 Senator)
- ↑ Statement of Vote (2002 Governor)
- ↑ Statement of Vote (2003 Recall Question)
- ↑ Statement of Vote (2003 Governor)
- ↑ Statement of Vote (2004 President)
- ↑ Statement of Vote (2004 Senator)
- ↑ Statement of Vote (2006 Governor)
- ↑ Statement of Vote (2006 Senator)
- ↑ (2008 President)
- ↑
- ↑
- ↑
- ↑ Martis, Kenneth C., The Historical Atlas of United States Congressional Districts, 1789-1983. New York: Macmillan Publishing, 1982.
- ↑ Martis, Kenneth C., The Historical Atlas of Political Parties in the United States Congress, 1789-1989. New York: Macmillan Publishing, 1989.
- ↑ Congressional Directory: Browse 105th Congress
- ↑ 1932 election results
- ↑ 1934 election results
- ↑ 1936 election results
- ↑ 1938 election results
- ↑ 1940 election results
- ↑ 1942 election results
- ↑ 1944 election results
- ↑ 1946 election results
- ↑ 1948 election results
- ↑ 1950 election results
- ↑ 1952 election results
- ↑ 1954 election results
- ↑ 1956 election results
- ↑ 1958 election results
- ↑ 1960 election results
- ↑ 1962 election results
- ↑ 1964 election results
- ↑ 1966 election results
- ↑ 1968 election results
- ↑ 1970 election results
- ↑ 1972 election results
- ↑ 1974 election results
- ↑ 1976 election results
- ↑ 1978 election results
- ↑ 1980 election results
- ↑ 1982 election results
- ↑ 1984 election results
- ↑ 1986 election results
- ↑ 1988 election results
- ↑ 1990 election results
- ↑ 1992 election results
- ↑ 1994 election results
- ↑ 1996 election results
- ↑ 1998 election results
- ↑ 2000 election results
- ↑ 2002 general election results Archived February 3, 2009, at the Wayback Machine.
- ↑ 2004 general election results
- ↑ 2006 general election results Archived November 27, 2008, at the Wayback Machine.
- ↑ 2008 special election results
- ↑ 2008 general election results Archived December 21, 2008, at the Wayback Machine.
- ↑ 2010 general election results
- ↑ 2012 general election results Archived October 19, 2013, at the Wayback Machine.
- ↑ 2014 general election results
External links
- GovTrack.us: California's 12th congressional district
- RAND California Election Returns: District Definitions (out of date)
- California Voter Foundation map - CD12 (out of date)
Coordinates: 37°46′N 122°25′W / 37.77°N 122.42°W