California's 23rd congressional district
| California's 23rd congressional district | ||
|---|---|---|
.tif.png) | ||
| Current Representative | Kevin McCarthy (R–Bakersfield) | |
| Ethnicity | 50.6% White, 5.9% Black, 4.5% Asian, 35.5% Hispanic, 3.5[1]% other | |
| Cook PVI | R+16 | |
California's 23rd congressional district is a congressional district in the U.S. state of California. The current district is centered in areas of the southern San Joaquin Valley and southern Sierra Nevada, the Tehachapi Mountains, and the northwestern Mojave Desert. It includes the cities of Mojave and Ridgecrest, as well as most of Bakersfield. Sequoia National Park and Sequoia National Forest are within it.
The district was represented in the 112th United States Congress by Republican Kevin McCarthy. In June 2014 McCarthy was elected Majority Leader of the House of Representatives.
Former characteristics
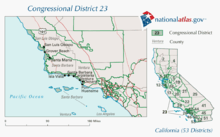
From 2003–2013 the district ran along the Pacific coasts of Ventura, Santa Barbara, and San Luis Obispo counties. Major cities in the district included Santa Barbara, San Luis Obispo, Ventura, and Oxnard.
Before redistricting by the California Citizens Redistricting Commission in 2011, California's 23rd Congressional District was one of the narrowest districts in the United States, stretching along the Pacific coast from Oxnard to the Monterey County line. It was often referred to as "the district that disappears at high tide"[2] or the "ribbon of shame".[3]
Voting
| Election results from statewide races | ||
|---|---|---|
| Year | Office | Results |
| 2010 | Governor | Brown 55.9 - 38.5% |
| Senator | Boxer 55.9 - 38.4% | |
| 2008 | President[4] | Obama 65.3 - 32.3% |
| 2006 | Governor[5] | Schwarzenegger 53.6 - 41.1% |
| Senator[6] | Feinstein 62.3 - 33.1% | |
| 2004 | President[7] | Kerry 58.3 - 40.3% |
| Senator[8] | Boxer 60.2 - 34.8% | |
| 2003 | Recall[9][10] | Yes 52.8 - 47.2% |
| Schwarzenegger 42.4 - 35.2% | ||
| 2002 | Governor[11] | Davis 48.0 - 40.7% |
| 2000 | President[12] | Gore 48.2 - 46.9% |
| Senator[13] | Feinstein 51.2 - 41.5% | |
| 1998 | Governor | |
| Senator | ||
| 1996 | President | |
| 1994 | Governor | |
| Senator | ||
| 1992 | President | Clinton 38.4 - 34.5% |
| Senator | Herschensohn 49.4 - 40.6% | |
| Senator | Feinstein 46.2 - 45.3% | |
List of representatives
| Representative | Party | Years | Notes | Counties |
|---|---|---|---|---|
| District created | January 3, 1943 | |||
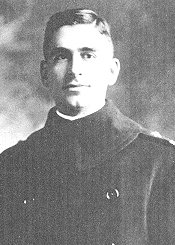 Edouard Izac Edouard Izac |
Democratic | January 3, 1943 – January 3, 1947 |
Redistricted from the 20th district Lost re-election |
San Diego |
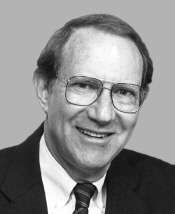
.jpg) Charles K. Fletcher Charles K. Fletcher |
Republican | January 3, 1947 – January 3, 1949 |
Lost re-election | |
.jpg) Clinton D. McKinnon Clinton D. McKinnon |
Democratic | January 3, 1949 – January 3, 1953 |
Retired to run for the US Senate | |
 Clyde Doyle Clyde Doyle |
Democratic | January 3, 1953 – March 14, 1963 |
Redistricted from the 18th district Died |
Los Angeles |
| Vacant | March 14, 1963 – June 11, 1963 |
|||
 Del M. Clawson Del M. Clawson |
Republican | June 11, 1963 – January 3, 1973 |
||
| January 3, 1973 – January 3, 1975 |
Redistricted to the 33rd district | Los Angeles, Orange | ||
 Thomas M. Rees Thomas M. Rees |
Democratic | January 3, 1975 – January 3, 1977 |
Redistricted from the 26th district Retired |
Los Angeles |
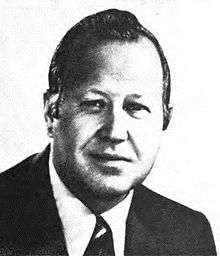
 Anthony C. Beilenson Anthony C. Beilenson |
Democratic | January 3, 1977 – January 3, 1983 |
||
| January 3, 1983 – January 3, 1993 |
Redistricted to the 24th district | Los Angeles (northern L.A. suburbs) | ||
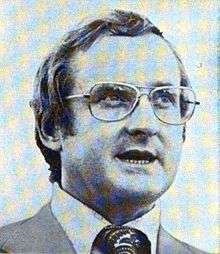
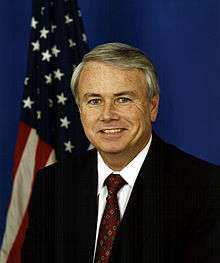 Elton Gallegly Elton Gallegly |
Republican | January 3, 1993 – January 3, 2003 |
Redistricted from the 21st district Redistricted to the 33rd district |
Santa Barbara (Carpinteria), Ventura |
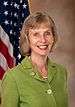 Lois Capps Lois Capps |
Democratic | January 3, 2003 – January 3, 2013 |
Redistricted from the 22nd district Redistricted to the 24th district |
Coastal San Luis Obispo, Santa Barbara, Ventura |
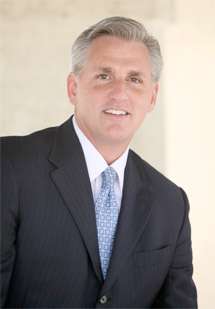 Kevin McCarthy Kevin McCarthy |
Republican | January 3, 2013 – present |
Redistricted from the 22nd district | Southern Central Valley including parts of Bakersfield |
Election results
|
1942 • 1944 • 1946 • 1948 • 1950 • 1952 • 1954 • 1956 • 1958 • 1960 • 1962 • 1963 (Special) • 1964 • 1966 • 1968 • 1970 • 1972 • 1974 • 1976 • 1978 • 1980 • 1982 • 1984 • 1986 • 1988 • 1990 • 1992 • 1994 • 1996 • 1998 • 2000 • 2002 • 2004 • 2006 • 2008 • 2010 • 2012 |
1942
| Party | Candidate | Votes | % | |
|---|---|---|---|---|
| Democratic | Edouard Izac (incumbent) | 42,864 | 50.5 | |
| Republican | James B. Abbey | 42,087 | 49.5 | |
| Total votes | 84,951 | 100.0 | ||
| Voter turnout | % | |||
| Democratic hold | ||||
1944
| Party | Candidate | Votes | % | |
|---|---|---|---|---|
| Democratic | Edouard Izac (incumbent) | 86,707 | 55.1 | |
| Republican | James B. Abbey | 70,787 | 44.9 | |
| Total votes | 157,494 | 100.0 | ||
| Voter turnout | % | |||
| Democratic hold | ||||
1946
| Party | Candidate | Votes | % | |||
|---|---|---|---|---|---|---|
| Republican | Charles K. Fletcher | 69,411 | 56.3 | |||
| Democratic | Edouard Izac (incumbent) | 53,898 | 43.7 | |||
| Total votes | 123,309 | 100.0 | ||||
| Voter turnout | % | |||||
| Republican gain from Democratic | ||||||
1948
| Party | Candidate | Votes | % | |||
|---|---|---|---|---|---|---|
| Democratic | Clinton D. McKinnon | 112,534 | 55.8 | |||
| Republican | Charles K. Fletcher (inc.) | 87,138 | 43.2 | |||
| Progressive | Harry C. Steinmetz | 2,017 | 1.0 | |||
| Total votes | 201,689 | 100.0 | ||||
| Voter turnout | % | |||||
| Democratic gain from Republican | ||||||
1950
| Party | Candidate | Votes | % | |
|---|---|---|---|---|
| Democratic | Clinton D. McKinnon (inc.) | 94,137 | 51 | |
| Republican | Leslie E. Gehres | 90,398 | 49 | |
| Total votes | 184,535 | 100.0 | ||
| Voter turnout | % | |||
| Democratic hold | ||||
1952
| Party | Candidate | Votes | % | |
|---|---|---|---|---|
| Democratic | Clyde Doyle (incumbent) | 138,356 | 87.5 | |
| Progressive | Olive T. Thompson | 17,501 | 11.1 | |
| Republican | C. Cleveland (write-in) | 2,329 | 1.4 | |
| Total votes | 158,186 | 100.0 | ||
| Voter turnout | % | |||
| Democratic hold | ||||
1954
| Party | Candidate | Votes | % | |
|---|---|---|---|---|
| Democratic | Clyde Doyle (incumbent) | 90,729 | 70.9 | |
| Republican | Frank G. Bussing | 34,911 | 27.3 | |
| Progressive | Olive T. Thompson | 2,293 | 1.8 | |
| Total votes | 127,933 | 100.0 | ||
| Voter turnout | % | |||
| Democratic hold | ||||
1956
| Party | Candidate | Votes | % | |
|---|---|---|---|---|
| Democratic | Clyde Doyle (incumbent) | 120,109 | 70.9 | |
| Republican | E. Elgie "Cal" Calvin | 49,198 | 29.1 | |
| Total votes | 169,207 | 100.0 | ||
| Voter turnout | % | |||
| Democratic hold | ||||
1958
| Party | Candidate | Votes | % | |
|---|---|---|---|---|
| Democratic | Clyde Doyle (incumbent) | 140,817 | 100.0 | |
| Voter turnout | % | |||
| Democratic hold | ||||
1960
| Party | Candidate | Votes | % | |
|---|---|---|---|---|
| Democratic | Clyde Doyle (incumbent) | 148,415 | 74.2 | |
| Republican | Emmett A. Schwartz | 51,548 | 25.8 | |
| Total votes | 199,963 | 100.0 | ||
| Voter turnout | % | |||
| Democratic hold | ||||
1962
| Party | Candidate | Votes | % | |
|---|---|---|---|---|
| Democratic | Clyde Doyle (incumbent) | 83,269 | 64.2 | |
| Republican | Emmett A. Schwartz | 46,488 | 35.8 | |
| Total votes | 129,757 | 100.0 | ||
| Voter turnout | % | |||
| Democratic hold | ||||
1963 (Special)
| Party | Candidate | Votes | % | |||
|---|---|---|---|---|---|---|
| Republican | Del M. Clawson | ' | 53.2 | |||
| Democratic | Carley V. Porter | 35.4 | ||||
| Democratic | Maurice H. Quigley | 4.7 | ||||
| Democratic | Armand R. Porter | 2.7 | ||||
| Democratic | James Earle Christo | 1.4 | ||||
| Democratic | Lynn W. Johnston | 1.4 | ||||
| Republican | Harold R. "Hal" Bennett | 0.6 | ||||
| Republican | Harry L. Butler | 0.6 | ||||
| Total votes | ' | 100.0 | ||||
| Voter turnout | % | |||||
| Republican gain from Democratic | ||||||
1964
| Party | Candidate | Votes | % | |
|---|---|---|---|---|
| Republican | Del M. Clawson (incumbent) | 90,721 | 55.4 | |
| Democratic | H. O. Van Pettin | 72,903 | 44.6 | |
| Total votes | 163,624 | 100.0 | ||
| Voter turnout | % | |||
| Republican hold | ||||
1966
| Party | Candidate | Votes | % | |
|---|---|---|---|---|
| Republican | Del M. Clawson (incumbent) | 93,320 | 67.4 | |
| Democratic | Ed O'Connor | 45,141 | 32.6 | |
| Total votes | 138,461 | 100.0 | ||
| Voter turnout | % | |||
| Republican hold | ||||
1968
| Party | Candidate | Votes | % | |
|---|---|---|---|---|
| Republican | Del M. Clawson (incumbent) | 95,628 | 64.9 | |
| Democratic | Jim Sperrazzo | 51,606 | 35.1 | |
| Total votes | 147,234 | 100.0 | ||
| Voter turnout | % | |||
| Republican hold | ||||
1970
| Party | Candidate | Votes | % | |
|---|---|---|---|---|
| Republican | Del M. Clawson (incumbent) | 77,346 | 63.3 | |
| Democratic | G. L. "Jerry" Chapman | 44,767 | 36.7 | |
| Total votes | 122,113 | 100.0 | ||
| Voter turnout | % | |||
| Republican hold | ||||
1972
| Party | Candidate | Votes | % | |
|---|---|---|---|---|
| Republican | Del M. Clawson (incumbent) | 118,731 | 61.4 | |
| Democratic | Conrad G. Tuohey | 74,561 | 38.6 | |
| Total votes | 193,292 | 100.0 | ||
| Voter turnout | % | |||
| Republican hold | ||||
1974
| Party | Candidate | Votes | % | |
|---|---|---|---|---|
| Democratic | Thomas M. Rees (incumbent) | 119,239 | 71.4 | |
| Republican | Jack E. Roberts | 47,615 | 28.6 | |
| Total votes | 166,854 | 100.0 | ||
| Voter turnout | % | |||
| Democratic hold | ||||
1976
| Party | Candidate | Votes | % | |
|---|---|---|---|---|
| Democratic | Anthony C. Beilenson | 130,619 | 60.2 | |
| Republican | Thomas F. Bartman | 86,434 | 39.8 | |
| Total votes | 217,053 | 100.0 | ||
| Voter turnout | % | |||
| Democratic hold | ||||
1978
| Party | Candidate | Votes | % | |
|---|---|---|---|---|
| Democratic | Anthony C. Beilenson (inc.) | 117,498 | 65.6 | |
| Republican | Joseph Barbara | 61,496 | 34.4 | |
| Total votes | 178,994 | 100.0 | ||
| Voter turnout | % | |||
| Democratic hold | ||||
1980
| Party | Candidate | Votes | % | |
|---|---|---|---|---|
| Democratic | Anthony C. Beilenson (inc.) | 126,020 | 63.2 | |
| Republican | Robert "Bob" Winckler | 62,742 | 31.5 | |
| Libertarian | Jeffrey P. Lieb | 10,623 | 5.3 | |
| Total votes | 199,385 | 100.0 | ||
| Voter turnout | % | |||
| Democratic hold | ||||
1982
| Party | Candidate | Votes | % | |
|---|---|---|---|---|
| Democratic | Anthony C. Beilenson (inc.) | 120,788 | 59.6 | |
| Republican | David Armor | 82,031 | 40.4 | |
| Total votes | 202,819 | 100.0 | ||
| Voter turnout | % | |||
| Democratic hold | ||||
1984
| Party | Candidate | Votes | % | |
|---|---|---|---|---|
| Democratic | Anthony C. Beilenson (inc.) | 140,461 | 61.6 | |
| Republican | Claude W. Parrish | 84,093 | 36.9 | |
| Libertarian | Larry Leathers | 3,580 | 1.6 | |
| Total votes | 228,134 | 100.0 | ||
| Voter turnout | % | |||
| Democratic hold | ||||
1986
| Party | Candidate | Votes | % | |
|---|---|---|---|---|
| Democratic | Anthony C. Beilenson (inc.) | 121,468 | 65.7 | |
| Republican | George Woolverton | 58,746 | 31.8 | |
| Peace and Freedom | Tom Hopke | 2,521 | 1.4 | |
| Libertarian | Taylor Rhodes | 2,019 | 1.1 | |
| Total votes | 184,754 | 100.0 | ||
| Voter turnout | % | |||
| Democratic hold | ||||
1988
| Party | Candidate | Votes | % | |
|---|---|---|---|---|
| Democratic | Anthony C. Beilenson (inc.) | 147,858 | 63.5 | |
| Republican | Jim Salomon | 77,184 | 33.1 | |
| Libertarian | John R. Vernon | 4,503 | 1.9 | |
| Peace and Freedom | John Honigsfeld | 3,316 | 1.4 | |
| No party | Write-ins | 18 | 0.0% | |
| Total votes | 232,879 | 100.0 | ||
| Voter turnout | % | |||
| Democratic hold | ||||
1990
| Party | Candidate | Votes | % | |
|---|---|---|---|---|
| Democratic | Anthony C. Beilenson (inc.) | 103,141 | 61.7 | |
| Republican | Jim Salomon | 57,118 | 34.2 | |
| Peace and Freedom | John Honigsfeld | 6,834 | 4.1 | |
| Total votes | 167,093 | 100.0 | ||
| Voter turnout | % | |||
| Democratic hold | ||||
1992
| Party | Candidate | Votes | % | |
|---|---|---|---|---|
| Republican | Elton Gallegly (incumbent) | 115,504 | 54.3 | |
| Democratic | Anita Perez Ferguson | 88,225 | 41.4 | |
| Libertarian | Jay C. Wood | 9,091 | 4.3 | |
| No party | Dunbar (write-in) | 61 | 0.0% | |
| Total votes | 212,881 | 100.0 | ||
| Voter turnout | % | |||
| Republican hold | ||||
1994
| Party | Candidate | Votes | % | |
|---|---|---|---|---|
| Republican | Elton Gallegly (incumbent) | 114,043 | 66.17 | |
| Democratic | Kevin Ready | 47,345 | 27.47 | |
| Libertarian | Bill Brown | 6,481 | 3.76 | |
| Green | Robert T. Marston | 4,457 | 2.59 | |
| No party | Nagode (write-in) | 14 | 0.01% | |
| Total votes | 172,340 | 100.0 | ||
| Voter turnout | % | |||
| Republican hold | ||||
1996
| Party | Candidate | Votes | % | |
|---|---|---|---|---|
| Republican | Elton Gallegly (incumbent) | 118,880 | 59.6 | |
| Democratic | Robert Unruhe | 70,035 | 35.2 | |
| Libertarian | Gail Lightfoot | 8,346 | 4.1 | |
| Natural Law | Stephen Hospodar | 2,246 | 1.1 | |
| Total votes | 199,507 | 100.0 | ||
| Voter turnout | % | |||
| Republican hold | ||||
1998
| Party | Candidate | Votes | % | |
|---|---|---|---|---|
| Republican | Elton Gallegly (incumbent) | 96,362 | 60.06 | |
| Democratic | Daniel "Dan" Gonzalez | 64,068 | 39.94 | |
| Total votes | 160,430 | 100.0 | ||
| Voter turnout | % | |||
| Republican hold | ||||
2000
| Party | Candidate | Votes | % | |
|---|---|---|---|---|
| Republican | Elton Gallegly (incumbent) | 119,479 | 54.1 | |
| Democratic | Michael Case | 89,918 | 40.7 | |
| Reform | Cary Savitch | 6,473 | 3.0 | |
| Libertarian | Roger Peebles | 3,708 | 1.6 | |
| Natural Law | Stephen P. Hospodar | 1,456 | 0.6 | |
| Total votes | 221,034 | 100.0 | ||
| Voter turnout | % | |||
| Republican hold | ||||
2002
| Party | Candidate | Votes | % | |
|---|---|---|---|---|
| Democratic | Lois Capps (incumbent) | 95,752 | 59.1 | |
| Republican | Beth Rogers | 62,604 | 38.6 | |
| Libertarian | James E. Hill | 3,866 | 2.3 | |
| Total votes | 162,222 | 100.0 | ||
| Voter turnout | % | |||
| Democratic hold | ||||
2004
| Party | Candidate | Votes | % | |
|---|---|---|---|---|
| Democratic | Lois Capps (incumbent) | 153,980 | 63.1 | |
| Republican | Don Regan | 83,926 | 34.3 | |
| Libertarian | Michael Favorite | 6,391 | 2.6 | |
| Total votes | 244,297 | 100.0 | ||
| Voter turnout | % | |||
| Democratic hold | ||||
2006
| Party | Candidate | Votes | % | |
|---|---|---|---|---|
| Democratic | Lois Capps (incumbent) | 114,661 | 65.2 | |
| Republican | Victor G. Tognazzini | 61,272 | 34.8 | |
| No party | H.A. Gardner, Jr. (write-in) | 18 | 0.0% | |
| Total votes | 175,951 | 100.0 | ||
| Voter turnout | % | |||
| Democratic hold | ||||
2008
| Party | Candidate | Votes | % | |
|---|---|---|---|---|
| Democratic | Lois Capps (incumbent) | 171,403 | 68.07 | |
| Republican | Matt Kokkonen | 80,385 | 31.93 | |
| Total votes | 251,788 | 100.00 | ||
| Voter turnout | 77.41% | |||
| Democratic hold | ||||
2010
| Party | Candidate | Votes | % | |
|---|---|---|---|---|
| Democratic | Lois Capps (incumbent) | 111,768 | 57.8 | |
| Republican | Tom Watson | 72,744 | 37.6 | |
| Libertarian | Darrell M. Stafford | 3,326 | 1.7 | |
| No party | John V. Hager | 5,625 | 2.9% | |
| Total votes | 193,463 | 100.0 | ||
| Voter turnout | % | |||
| Democratic hold | ||||
2012
| Party | Candidate | Votes | % | |
|---|---|---|---|---|
| Republican | Kevin McCarthy (incumbent) | 158,161 | 73.2 | |
| No party preference | Terry Phillips | 57,842 | 26.8 | |
| Total votes | 216,003 | 100.0 | ||
| Republican hold | ||||
2014
| United States House of Representatives elections, 2014 | ||||
|---|---|---|---|---|
| Primary election | ||||
| Party | Candidate | Votes | % | |
| Republican | Kevin McCarthy (incumbent) | 58,334 | 99.1 | |
| Democratic | Raul Garcia (write-in) | 313 | 0.5 | |
| Republican | Mike Biglay (write-in) | 157 | 0.3 | |
| No party preference | Ronald L. Porter (write-in) | 36 | 0.1 | |
| Libertarian | Gail K. Lightfoot (write-in) | 31 | 0.1 | |
| Green | Noah Calugaru (write-in) | 3 | 0.01 | |
| Total votes | 58,871 | 100.0 | ||
| General election | ||||
| Republican | Kevin McCarthy (incumbent) | 100,317 | 74.8 | |
| Democratic | Raul Garcia | 33,726 | 25.2 | |
| Total votes | 134,043 | 100.0 | ||
| Republican hold | ||||
Living former Members
As of April 2015, there are three former members of the U.S. House of Representatives from California's 23rd congressional district that are currently living.
| Representative | Term in office | Date of birth (and age) |
|---|---|---|
| Anthony C. Beilenson | 1977 - 1993 | October 26, 1932 |
| Elton Gallegly | 1993 - 2003 | March 7, 1944 |
| Lois Capps | 2003 - 2013 | January 10, 1938 |
Historical district boundaries
See also
References
- ↑ "California's citizen commission final district maps: Find out what's changed where you live". Los Angeles Times. August 2, 2011.
- ↑ Patrick McGreevy (December 19, 2010). "New redistricting panel takes aim at bizarre political boundaries". Los Angeles Times. Retrieved 2010-12-19.
- ↑ Aaron Blake (July 27, 2011). "Name that district! (Gerrymandering edition)". Washington Post. Retrieved 2011-07-28.
- ↑ (2008 President)
- ↑ Statement of Vote (2006 Governor)
- ↑ Statement of Vote (2006 Senator)
- ↑ Statement of Vote (2004 President)
- ↑ Statement of Vote (2004 Senator)
- ↑ Statement of Vote (2003 Recall Question)
- ↑ Statement of Vote (2003 Governor)
- ↑ Statement of Vote (2002 Governor)
- ↑ Statement of Vote (2000 President)
- ↑ Statement of Vote (2000 Senator)
- ↑ 1942 election results
- ↑ 1944 election results
- ↑ 1946 election results
- ↑ 1948 election results
- ↑ 1950 election results
- ↑ 1952 election results
- ↑ 1954 election results
- ↑ 1956 election results
- ↑ 1958 election results
- ↑ 1960 election results
- ↑ 1962 election results
- ↑ 1963 special election results
- ↑ 1964 election results
- ↑ 1966 election results
- ↑ 1968 election results
- ↑ 1970 election results
- ↑ 1972 election results
- ↑ 1974 election results
- ↑ 1976 election results
- ↑ 1978 election results
- ↑ 1980 election results
- ↑ 1982 election results
- ↑ 1984 election results
- ↑ 1986 election results
- ↑ 1988 election results
- ↑ 1990 election results
- ↑ 1992 election results
- ↑ 1994 election results
- ↑ 1996 election results
- ↑ 1998 election results
- ↑ 2000 election results
- ↑ 2002 general election results Archived February 3, 2009, at the Wayback Machine.
- ↑ 2004 general election results
- ↑ 2006 general election results Archived November 27, 2008, at the Wayback Machine.
- ↑ 2010 general election results
- ↑ 2012 general election results Archived October 19, 2013, at the Wayback Machine.
External links
- GovTrack.us: California's 23rd congressional district
- RAND California Election Returns: District Definitions
- California Voter Foundation map - CD23
Coordinates: 34°30′N 120°27′W / 34.5°N 120.45°W