Deptford (UK Parliament constituency)
| Deptford | |
|---|---|
|
Former Borough constituency for the House of Commons | |
| 1885–February 1974 | |
| Number of members | one |
| Replaced by | Lewisham Deptford |
| Created from | Greenwich |
Deptford was a parliamentary constituency centred on the Deptford district of South London. It returned one Member of Parliament to the House of Commons of the Parliament of the United Kingdom.
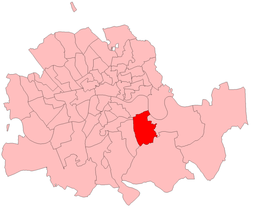
Deptford in the Metropolitan Board of Works area, showing boundaries used 1885-1918

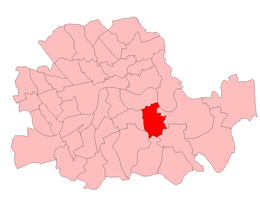
Deptford in the Parliamentary County of London 1918-49
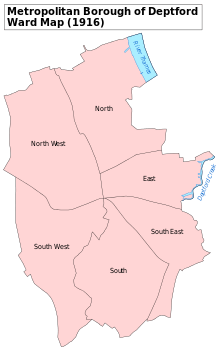
A map showing the wards of Deptford Metropolitan Borough as they appeared in 1916.
Deptford in the Parliamentary County of London 1950-74
The constituency was created for the 1885 general election, and abolished for the February 1974 general election, when it was largely replaced by the new constituency of Lewisham Deptford.
Boundaries
1918-1974: The Metropolitan Borough of Deptford.
Members of Parliament
| Election | Member[1] | Party | |
|---|---|---|---|
| 1885 | William John Evelyn | Conservative | |
| 1888 by-election | Charles John Darling, later Baron Darling | Conservative | |
| 1897 by-election | Arthur Henry Aylmer Morton | Conservative | |
| 1906 | Charles William Bowerman | Labour | |
| 1931 | Denis Augustine Hanley | Conservative | |
| 1935 | Walter Henry Green | Labour | |
| 1945 | John Wilmot | Labour | |
| 1950 | Jack Cooper | Labour | |
| 1951 | Sir Leslie Plummer | Labour | |
| 1963 by-election | John Silkin | Labour | |
| Feb 1974 | constituency abolished: see Lewisham Deptford | ||
Election results
Election in the 1970s
| Party | Candidate | Votes | % | ± | |
|---|---|---|---|---|---|
| Labour | Hon. John Ernest Silkin | 14,672 | 62.96 | ||
| Conservative | Michael Lewis Brotherton | 7,355 | 31.56 | ||
| National Front | Martin Vaux | 1,277 | 5.48 | ||
| Majority | 7,317 | 31.40 | |||
| Turnout | 23,304 | 54.67 | |||
| Labour hold | Swing | ||||
Elections in the 1960s
| Party | Candidate | Votes | % | ± | |
|---|---|---|---|---|---|
| Labour | Hon. John Ernest Silkin | 17,983 | 66.80 | ||
| Conservative | John R Giles | 7,033 | 26.12 | ||
| British National | Gerald Rowe | 1,906 | 7.08 | ||
| Majority | 10,950 | 40.67 | |||
| Turnout | 60.27 | ||||
| Labour hold | Swing | ||||
| Party | Candidate | Votes | % | ± | |
|---|---|---|---|---|---|
| Labour | John Silkin | 17,676 | 62.44 | ||
| Conservative | Murray M Leask | 8,248 | 29.13 | ||
| Independent | Colin M H Atkins | 2,386 | 8.43 | ||
| Majority | 9,428 | 33.30 | |||
| Turnout | 60.08 | ||||
| Labour hold | Swing | ||||
| Party | Candidate | Votes | % | ± | |
|---|---|---|---|---|---|
| Labour | John Silkin | 12,209 | 58.2 | ||
| Liberal | D J Penwarden | 4,726 | 22.5 | ||
| Conservative | John D Brimacombe | 4,023 | 19.2 | ||
| Majority | 7,483 | 35.7 | |||
| Turnout | 20,958 | ||||
| Labour hold | Swing | ||||
Elections in the 1950s
| Party | Candidate | Votes | % | ± | |
|---|---|---|---|---|---|
| Labour | Sir Leslie Arthur Plummer | 21,226 | 61.95 | ||
| Conservative | JD Brimacombe | 13,038 | 38.05 | ||
| Majority | 8,188 | 23.90 | |||
| Turnout | 69.34 | ||||
| Labour hold | Swing | ||||
| Party | Candidate | Votes | % | ± | |
|---|---|---|---|---|---|
| Labour | Sir Leslie Arthur Plummer | 23,925 | 65.73 | ||
| Conservative | Miss Irene Dowling | 12,472 | 34.27 | ||
| Majority | 11,453 | 31.47 | |||
| Turnout | 69.62 | ||||
| Labour hold | Swing | ||||
| Party | Candidate | Votes | % | ± | |
|---|---|---|---|---|---|
| Labour | Sir Leslie Arthur Plummer | 28,878 | 65.17 | ||
| Conservative | Miss Irene Dowling | 15,431 | 34.83 | ||
| Majority | 13,447 | 30.35 | |||
| Turnout | 80.27 | ||||
| Labour hold | Swing | ||||
| Party | Candidate | Votes | % | ± | |
|---|---|---|---|---|---|
| Labour | Jack Cooper | 28,230 | 63.07 | ||
| Conservative | Geoffrey F. Sarjeant | 13,330 | 29.78 | ||
| Liberal | Edward Isaac Miller | 2,637 | 5.89 | ||
| Communist | Leslie Francis Stannard | 562 | 1.26 | ||
| Majority | 14,900 | 33.29 | |||
| Turnout | 81.61 | ||||
| Labour hold | Swing | ||||
Election in the 1940s
| Party | Candidate | Votes | % | ± | |
|---|---|---|---|---|---|
| Labour | John Charles Wilmot | 22,313 | |||
| Conservative | Sqdn-Ldr. E Cuddon | 8,059 | |||
| Majority | |||||
| Turnout | |||||
| Labour hold | Swing | ||||
Election in the 1930s
| Party | Candidate | Votes | % | ± | |
|---|---|---|---|---|---|
| Labour | Walter Henry Green | 27,021 | 57.31 | ||
| Conservative | Sir Malcolm Campbell | 20,129 | 42.69 | ||
| Majority | 6,892 | 14.62 | |||
| Turnout | |||||
| Labour gain from Conservative | Swing | ||||
| Party | Candidate | Votes | % | ± | |
|---|---|---|---|---|---|
| Conservative | Denis Augustine Hanley | ||||
| Labour | Rt Hon. Charles William Bowerman | ||||
| Majority | |||||
| Turnout | |||||
Election in the 1920s
| Party | Candidate | Votes | % | ± | |
|---|---|---|---|---|---|
| Labour | Rt Hon. Charles William Bowerman | 26,848 | 55.2 | ||
| Unionist | Ernest Everard Gates | 14,832 | 30.5 | ||
| Liberal | H. Charles Bevan | 6,935 | 14.3 | n/a | |
| Majority | 12,016 | 24.7 | |||
| Turnout | |||||
| Labour hold | Swing | ||||
| Party | Candidate | Votes | % | ± | |
|---|---|---|---|---|---|
| Labour | Rt Hon. Charles William Bowerman | 21,903 | |||
| Unionist | James Hargreaves | 18,279 | |||
| Majority | |||||
| Turnout | |||||
| Labour hold | Swing | ||||
| Party | Candidate | Votes | % | ± | |
|---|---|---|---|---|---|
| Labour | Rt Hon. Charles William Bowerman | 21,576 | |||
| Unionist | Marshall James Pike | 12,666 | |||
| Majority | |||||
| Turnout | |||||
| Labour hold | Swing | ||||
| Party | Candidate | Votes | % | ± | |
|---|---|---|---|---|---|
| Labour | Rt Hon. Charles William Bowerman | 18,512 | |||
| Unionist | Marshall James Pike | 16,687 | |||
| Majority | |||||
| Turnout | |||||
| Labour hold | Swing | ||||
Elections in the 1910s
| Party | Candidate | Votes | % | ± | |
|---|---|---|---|---|---|
| Labour | Rt Hon. Charles William Bowerman | 14,073 | |||
| Conservative | John Theodore Prestige | 9,711 | |||
| NFDDSS | F. A. Rumsey | 2,106 | 8.1 | ||
| Majority | 51,611 | ||||
| Turnout | |||||
| Labour hold | Swing | ||||
| Party | Candidate | Votes | % | ± | |
|---|---|---|---|---|---|
| Labour | Charles William Bowerman | 6,357 | 51.4 | -0.6 | |
| Conservative | Stuart Auchinloss Coats | 5,999 | 48.6 | 0.6 | |
| Majority | 358 | ||||
| Turnout | 15,159 | 81.5 | |||
| Labour hold | Swing | ||||
| Party | Candidate | Votes | % | ± | |
|---|---|---|---|---|---|
| Labour | Charles William Bowerman | 6,880 | 52.0 | -0.2 | |
| Conservative | Stuart Auchinloss Coats | 6,358 | 48.0 | 6.3 | |
| Majority | 522 | ||||
| Turnout | 15,159 | 87.3 | |||
| Labour hold | Swing | ||||
Elections in the 1900s
Vivian
| Party | Candidate | Votes | % | ± | |
|---|---|---|---|---|---|
| Labour | Charles William Bowerman | 6,236 | 52.2 | N/A | |
| Conservative | Arthur Henry Aylmer Morton | 4,977 | 41.7 | -20.4 | |
| Liberal | Herbert Vivian | 726 | 6.1 | ||
| Majority | 1,259 | ||||
| Turnout | 15,397 | 77.5 | |||
| Labour gain from Conservative | Swing | ||||
| Party | Candidate | Votes | % | ± | |
|---|---|---|---|---|---|
| Conservative | Arthur Henry Aylmer Morton | 6,236 | 62.1 | 10.5 | |
| Lib-Lab | Ben Jones | 3,806 | 37.9 | -10.5 | |
| Majority | 2,430 | ||||
| Turnout | 15,000 | 66.9 | |||
| Conservative hold | Swing | ||||
Elections in the 1890s
| Party | Candidate | Votes | % | ± | |
|---|---|---|---|---|---|
| Conservative | Arthur Henry Aylmer Morton | 5,317 | 51.6 | -4.5 | |
| Liberal | John Williams Benn | 4,993 | 48.4 | 4.5 | |
| Majority | 324 | ||||
| Turnout | 13,868 | 74.3 | |||
| Conservative hold | Swing | ||||
| Party | Candidate | Votes | % | ± | |
|---|---|---|---|---|---|
| Conservative | Charles John Darling | 5,654 | 56.1 | 3.3 | |
| Liberal | Thomas James Macnamara | 4,425 | 43.9 | -3.3 | |
| Majority | 1,229 | ||||
| Turnout | 13,815 | 73.0 | |||
| Conservative hold | Swing | ||||
| Party | Candidate | Votes | % | ± | |
|---|---|---|---|---|---|
| Conservative | Charles John Darling | 5,298 | 52.8 | 1.2 | |
| Liberal | Lord Edmond Fitzmaurice | 4,733 | 47.2 | -1.2 | |
| Majority | 565 | ||||
| Turnout | 13,066 | 76.8 | |||
| Conservative hold | Swing | ||||
Elections in the 1880s
| Party | Candidate | Votes | % | ± | |
|---|---|---|---|---|---|
| Conservative | Charles John Darling | 4,345 | 51.6 | -3.1 | |
| Liberal | Wilfrid Scawen Blunt | 4,070 | 48.4 | 3.1 | |
| Majority | 275 | ||||
| Turnout | 10,473 | 80.3 | |||
| Conservative hold | Swing | ||||
| Party | Candidate | Votes | % | ± | |
|---|---|---|---|---|---|
| Conservative | William John Evelyn | 3,682 | 54.7 | 2.2 | |
| Liberal | Lalmohun Ghose | 3,055 | 45.3 | -2.2 | |
| Majority | 627 | ||||
| Turnout | 9,371 | 71.9 | |||
| Conservative hold | Swing | ||||
| Party | Candidate | Votes | % | ± | |
|---|---|---|---|---|---|
| Conservative | William John Evelyn | 3,927 | 52.5 | ||
| Liberal | Lalmohun Ghose | 3,560 | 47.5 | ||
| Majority | 367 | ||||
| Turnout | 9,371 | 79.9 | |||
| Conservative gain from new seat | Swing | ||||
References
- ↑ Leigh Rayment's Historical List of MPs – Constituencies beginning with "D" (part 1)
- ↑ http://www.webcitation.org/query?url=http://www.geocities.com/by_elections/63.html%23luton&date=2009-10-25+19:14:28
- ↑ British parliamentary election results, 1950-1973, FWS Craig
- British Parliamentary Election Results 1885-1918, compiled and edited by F.W.S. Craig (Macmillan Press 1974)
- Debrett’s Illustrated Heraldic and Biographical House of Commons and the Judicial Bench 1886
- Debrett’s House of Commons and the Judicial Bench 1901
- Debrett’s House of Commons and the Judicial Bench 1918
This article is issued from Wikipedia - version of the 9/27/2016. The text is available under the Creative Commons Attribution/Share Alike but additional terms may apply for the media files.