Greater London Council election, 1977
| | |||||||||||||||||||||||
| |||||||||||||||||||||||
| |||||||||||||||||||||||
|
| |||||||||||||||||||||||
| Results by parliamentary constituency. | |||||||||||||||||||||||
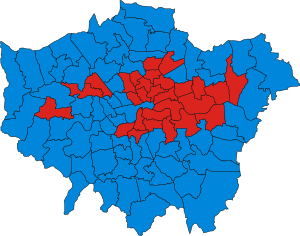
These are the results for the 5 May 1977 Greater London Council election.
| Political Party | Votes | Share of Vote (%) | % Change | Candidates | Seats Won | Seats Change | |
|---|---|---|---|---|---|---|---|
| Conservative | 1,177,390 | 52.5 | +14.5 | 92 | 64 | +32 | |
| Labour | 737,194 | 32.9 | -14.5 | 92 | 28 | -30 | |
| Liberal | 174,405 | 7.8 | -4.7 | 92 | 0 | -2 | |
| National Front | 119,060 | 5.3 | +4.8 | 91 | 0 | 0 | |
| National Party | 8,300 | 0.4 | N/A | 22 | 0 | 0 | |
| Communist | 8,267 | 0.4 | -0.2 | 24 | 0 | 0 | |
| GLC Abolitionist Campaign | 7,869 | 0.4 | N/A | 31 | 0 | 0 | |
| International Marxist | 1,930 | 0.1 | N/A | 4 | 0 | 0 | |
| Independent | 1,834 | 0.1 | -0.1 | 9 | 0 | 0 | |
| People | 1,621 | 0.1 | N/A | 2 | 0 | 0 | |
| Independent Conservative | 1,025 | 0.0 | -0.1 | 1 | 0 | 0 | |
| Independent Liberal | 878 | 0.0 | N/A | 3 | 0 | 0 | |
| English National | 685 | 0.0 | N/A | 5 | 0 | 0 | |
| Fellowship | 552 | 0.0 | N/A | 1 | 0 | 0 | |
| Socialist (GB) | 502 | 0.0 | -0.1 | 4 | 0 | 0 | |
| Ecology | 298 | 0.0 | N/A | 1 | 0 | 0 | |
| New Britain | 254 | 0.0 | N/A | 1 | 0 | 0 | |
Turnout: 2,242,064 people voted
References
| County councils (England) |
|
|---|---|
| County councils (Wales) |
|
| Unicameral area | |
| District councils (Scotland) |
|
| District councils (Northern Ireland) |
|
| Sui generis |
|
This article is issued from Wikipedia - version of the 9/26/2016. The text is available under the Creative Commons Attribution/Share Alike but additional terms may apply for the media files.