Las Flores, Buenos Aires
| Las Flores | |||
|---|---|---|---|
| |||
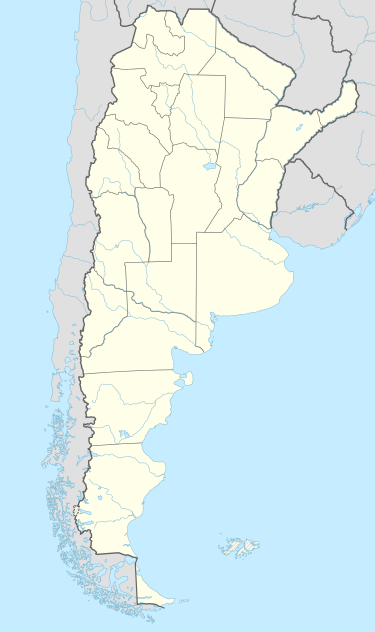 Las Flores Location in Argentina | |||
| Coordinates: 36°0′50″S 59°06′00″W / 36.01389°S 59.10000°WCoordinates: 36°0′50″S 59°06′00″W / 36.01389°S 59.10000°W | |||
| Country |
| ||
| Province |
| ||
| Partido |
| ||
| Founded | May 25, 1856 | ||
| Elevation | 36 m (118 ft) | ||
| Population (2010 census [INDEC]) | |||
| • Total | 23,871 | ||
| CPA Base | B 7200 | ||
| Area code(s) | +54 2244 | ||


Las Flores is a town in the province of Buenos Aires, Argentina, and the only city in Las Flores Partido. It had a population of about 24,000 inhabitants per the 2010 census [INDEC]. It is located 187 km from Buenos Aires City. The main economic activities in the area are agriculture and cattle breeding.
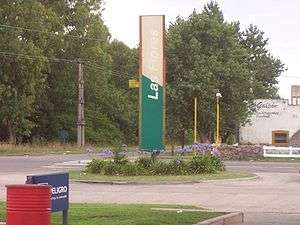
Las Flores sign
Climate
| Climate data for Las Flores, Buenos Aires Province (1961–1990, extremes 1970–present) | |||||||||||||
|---|---|---|---|---|---|---|---|---|---|---|---|---|---|
| Month | Jan | Feb | Mar | Apr | May | Jun | Jul | Aug | Sep | Oct | Nov | Dec | Year |
| Record high °C (°F) | 39.5 (103.1) |
37.0 (98.6) |
38.0 (100.4) |
33.5 (92.3) |
31.0 (87.8) |
25.0 (77) |
29.3 (84.7) |
32.5 (90.5) |
33.0 (91.4) |
32.5 (90.5) |
36.4 (97.5) |
39.8 (103.6) |
39.8 (103.6) |
| Average high °C (°F) | 30.6 (87.1) |
29.6 (85.3) |
25.6 (78.1) |
21.3 (70.3) |
17.5 (63.5) |
14.2 (57.6) |
14.0 (57.2) |
15.3 (59.5) |
18.1 (64.6) |
21.4 (70.5) |
25.4 (77.7) |
28.5 (83.3) |
21.8 (71.2) |
| Daily mean °C (°F) | 22.8 (73) |
21.9 (71.4) |
18.9 (66) |
14.8 (58.6) |
11.8 (53.2) |
9.1 (48.4) |
9.1 (48.4) |
9.7 (49.5) |
12.2 (54) |
15.1 (59.2) |
18.4 (65.1) |
20.9 (69.6) |
15.4 (59.7) |
| Average low °C (°F) | 15.0 (59) |
14.2 (57.6) |
12.2 (54) |
8.3 (46.9) |
6.1 (43) |
4.0 (39.2) |
4.2 (39.6) |
4.1 (39.4) |
6.3 (43.3) |
8.8 (47.8) |
11.4 (52.5) |
13.3 (55.9) |
9.0 (48.2) |
| Record low °C (°F) | 2.2 (36) |
1.2 (34.2) |
1.1 (34) |
−4.7 (23.5) |
−7.6 (18.3) |
−7.9 (17.8) |
−9.8 (14.4) |
−6.5 (20.3) |
−6.0 (21.2) |
−5.5 (22.1) |
−3.9 (25) |
0.0 (32) |
−9.8 (14.4) |
| Average precipitation mm (inches) | 98 (3.86) |
92 (3.62) |
96 (3.78) |
94 (3.7) |
59 (2.32) |
48 (1.89) |
50 (1.97) |
52 (2.05) |
61 (2.4) |
101 (3.98) |
100 (3.94) |
98 (3.86) |
949 (37.36) |
| Average precipitation days (≥ 0.1 mm) | 9 | 7 | 8 | 7 | 7 | 7 | 7 | 6 | 6 | 10 | 9 | 8 | 91 |
| Average relative humidity (%) | 68 | 73 | 78 | 79 | 83 | 82 | 83 | 79 | 74 | 74 | 67 | 66 | 76 |
| Source #1: Food and Agriculture Organization[1] | |||||||||||||
| Source #2: Oficina de Riesgo Agropecuario (record highs and lows),[2] Servicio Meteorológico Nacional (humidity, 1981–1990 and precipitation days 1961–1990)[3][4] | |||||||||||||
References
- ↑ "FAOClim-NET: Agroclimatic database management system". Food and Agriculture Organization. Retrieved July 29, 2016.
- ↑ "Las Flores, Buenos Aires". Estadísticas meteorológicas decadiales (in Spanish). Oficina de Riesgo Agropecuario. Retrieved July 2, 2015.
- ↑ "Datos Estadísticos (Período 1981–1990)" (in Spanish). Servicio Meteorológico Nacional. Retrieved July 2, 2015.
- ↑ "Valores Medios de Temperature y Precipitación-Buenos Aires: Las Flores" (in Spanish). Servicio Meteorológico Nacional. Retrieved July 29, 2016.
- Municipality of Las Flores - Official website.
- Municipal information: Municipal Affairs Federal Institute (IFAM), Municipal Affairs Secretariat, Ministry of Interior, Argentina. (Spanish)
This article is issued from Wikipedia - version of the 9/1/2016. The text is available under the Creative Commons Attribution/Share Alike but additional terms may apply for the media files.