List of imports of the United States
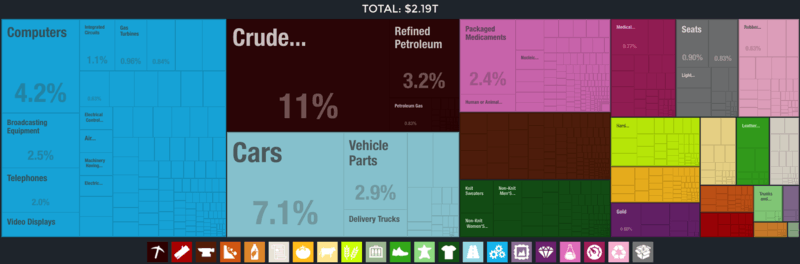
United States imports 2014. atlas.media.mit.edu
The following is a list of imports into the United States.
Data is for 2015, in $Billions of United States dollars.[1]
| # | Product | Value |
|---|---|---|
| 1 | Electronic equipment | $332.9 |
| Phone system devices - $102.4 | ||
| Integrated circuits/microassemblies - $28.8 | ||
| TV receivers/monitors/projectors - $26.9 | ||
| Insulated wire/cable - $19.9 | ||
| Electrical converters/power units - $14.5 | ||
| Solar power diodes/semi-conductors - $11.6 | ||
| TV receiver/transmit/digital cameras - $10.6 | ||
| Lower-voltage switches, fuses - $10.2 | ||
| Electrical/optical circuit boards, panels - $10.1 | ||
| Electric motors, generators - $9.2 | ||
| 2 | Machines, engines, pumps | $329.3 |
| Computers, optical readers - $81.4 | ||
| Turbo-jets - $22.2 | ||
| Printing machinery - $18.3 | ||
| Computer parts, accessories - $17.7 | ||
| Taps, valves, similar appliances - $15.2 | ||
| Piston engines - $11.3 | ||
| Liquid pumps and elevators - $10.7 | ||
| Air or vacuum pumps - $10.4 | ||
| Piston engine parts - $10.2 | ||
| Transmission shafts, gears, clutches - $8.8 | ||
| 3 | Vehicles | $283.8 |
| Cars - $169.1 | ||
| Automobile parts/accessories - $66.5 | ||
| Trucks - $23.5 | ||
| Tractors - $12.1 | ||
| Trailers - $3.3 | ||
| Motorcycles - $2.2 | ||
| Bicycles, other non-motorized cycles - $1.7 | ||
| Motorcycle parts/accessories - $1.5 | ||
| Automobile bodies - $.984 | ||
| Public-transport vehicles - $.859 | ||
| 4 | Fuel | $201.2 |
| Crude oil - $132.6 | ||
| Processed petroleum oils - $51.4 | ||
| Petroleum gases - $11.1 | ||
| Electrical energy - $2.4 | ||
| Petroleum oil residues - $1 | ||
| Coal, solid fuels made from coal - $.872 | ||
| Coal tar oils (high temperature distillation) - $.535 | ||
| Petroleum jelly, mineral waxes - $.496 | ||
| Peat - $.332 | ||
| Natural bitumen, asphalt, shale - $.238 | ||
| 5 | Pharmaceuticals | $86.1 |
| 6 | Medical, technical equipment | $78.3 |
| 7 | Furniture, lighting, signs | $61.2 |
| 8 | Gems, precious metals | $60.2 |
| 9 | Organic chemicals | $52.1 |
| 10 | Plastics | $50.2 |
| Total | $2.309 trillion |
See also
- Comparison of imports vs exports of the United States
- List of exports of the United States
- List of the largest trading partners of the United States
- Value added tax trade criticism
References
- ↑ "United States Top 10 Imports". 4 November 2016.
This article is issued from Wikipedia - version of the 12/1/2016. The text is available under the Creative Commons Attribution/Share Alike but additional terms may apply for the media files.