List of countries by natural gas production
.svg.png)
This is a list of countries by natural gas production based on statistics from the International Energy Agency.[1]
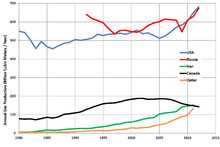
According to the International Energy Agency, the top 10 natural gas producers in 2013 were (in billion cubic meters): 1) United States 689 (19.8%), 2) Russia 671 (19.3%), 3) Qatar 161 (4.6%), 4) Iran 159 (4.6%), 5) Canada 155 (4.5%), 6) China 115 (3.3%), 7) Norway 109 (3.1%), 8) Netherlands 86 (2.5%), 9) Saudi Arabia 84 (2.4%), 10) Algeria 80 (2.3%), together producing two thirds of the total world production of 3,479 billion cubic meters.[2]
Production trends
In 2009, world production of natural gas was cut down by 2.8%.[3] Different trends were noticed among largest gas producers. The US became the world's largest gas producer in 2009, exceeding Russian volumes.[4]
In 2010, Russia returned to first place.[5] Its production increased by 4.4% and balanced a shrinking output in the European countries (-9%, despite increasing outputs in Norway and the Netherlands). The OECD thus posted a slight growth of 0.1% in 2009. Conversely, gas production in Russia was scaled down by 12% while Algeria experienced a substantial decline in its production (-6%). In the Middle East, gas production development slowed down and grew at a slower pace than the previous year (4% from 7% in 2008).
Natural gas production
The data in the following table comes from The World Factbook.[6]
| Rank | Country | Continent | Annual natural gas production (m³) | Date of information |
|---|---|---|---|---|
| — | World | — | 4,359,000,000,000 | 2010 est. |
| 1 | North America | 728,200,000,000 | 2014 est. | |
| 2 | Eurasia | 578,700,000,000 | 2014 est. | |
| — | — | 132,300,000,000 | 2014 est. | |
| 3 | Asia | 162,600,000,000 | 2012 est. | |
| 4 | North America | 143,100,000,000 | 2012 est. | |
| 5 | Asia | 133,200,000,000 | 2011 est. | |
| 6 | Europe | 114,700,000,000 | 2012 est. | |
| 7 | Asia | 107,200,000,000 | 2012 est. | |
| 8 | Asia | 103,200,000,000 | 2012 est. | |
| 9 | Africa | 82,760,000,000 | 2011 est. | |
| 10 | Europe | 80,780,000,000 | 2012 est. | |
| 11 | Asia | 76,250,000,000 | 2011 est. | |
| 12 | Asia | 64,400,000,000 | 2012 est. | |
| 13 | Asia | 62,900,000,000 | 2012 est. | |
| 14 | Asia | 61,730,000,000 | 2011 est. | |
| 15 | Africa | 61,260,000,000 | 2011 est. | |
| 16 | North America | 53,960,000,000 | 2012 est. | |
| 17 | Asia | 52,310,000,000 | 2011 est. | |
| 18 | South America | 48,970,000,000 | 2012 est. | |
| 19 | Oceania | 48,240,000,000 | 2012 est. | |
| 20 | Europe | 40,990,000,000 | 2012 est. | |
| 21 | Caribbean | 40,600,000,000 | 2011 est. | |
| 22 | Asia | 40,380,000,000 | 2012 est. | |
| 23 | Asia | 39,150,000,000 | 2011 est. | |
| 24 | South America | 38,770,000,000 | 2011 est. | |
| 25 | Asia | 36,990,000,000 | 2011 est. | |
| 26 | Asia | 35,940,000,000 | 2012 est. | |
| 27 | South America | 32,400,000,000 | 2012 est. | |
| 28 | Africa | 31,360,000,000 | 2011 est. | |
| 29 | South America | 25,280,000,000 | 2012 est. | |
| 30 | Asia | 20,200,000,000 | 2011 est. | |
| 31 | Asia | 20,110,000,000 | 2011 est. | |
| 32 | Europe | 19,800,000,000 | 2011 est. | |
| 33 | Asia | 16,700,000,000 | 2013 [7] | |
| 34 | South America | 17,030,000,000 | 2012 est. | |
| 35 | Asia | 13,530,000,000 | 2011 est. | |
| 36 | Asia | 12,620,000,000 | 2011 est. | |
| 37 | Asia | 12,440,000,000 | 2011 est. | |
| 38 | Asia | 11,910,000,000 | 2011 est. | |
| 39 | South America | 10,950,000,000 | 2011 est. | |
| 40 | Europe | 10,610,000,000 | 2011 est. | |
| 41 | Asia | 9,620,000,000 | 2011 est. | |
| 42 | Asia | 9,300,000,000 | 2012 est. | |
| 43 | Europe | 9,000,000,000 | 2012 est. | |
| 44 | Asia | 7,870,000,000 | 2011 est. | |
| 45 | Africa | 7,855,000,000 | 2011 est. | |
| 46 | Europe | 7,800,000,000 | 2012 est. | |
| 47 | Africa | 6,880,000,000 | 2011 est. | |
| 48 | Asia | 6,860,000,000 | 2013 est. | |
| 49 | Europe | 6,412,000,000 | 2012 est. | |
| 50 | Europe | 6,193,000,000 | 2012 est. | |
| 51 | Europe | 4,904,000,000 | 2012 est. | |
| 52 | Oceania | 4,590,000,000 | 2012 est. | |
| 53 | Asia | 3,910,000,000 | 2012 est. | |
| 54 | Africa | 3,820,000,000 | 2011 est. | |
| 55 | Asia | 3,273,000,000 | 2012 est. | |
| 56 | Europe | 2,462,000,000 | 2012 est. | |
| 57 | Africa | 1,930,000,000 | 2011 est. | |
| 58 | Europe | 1,906,000,000 | 2012 est. | |
| 59 | Europe | 1,863,000,000 | 2013 est. | |
| 60 | Africa | 1,500,000,000 | 2011 est. | |
| 61 | Africa | 1,280,000,000 | 2011 est. | |
| 62 | South America | 1,144,000,000 | 2012 est. | |
| 63 | Caribbean | 1,030,000,000 | 2012 est. | |
| 64 | Africa | 946,000,000 | 2012 est. | |
| 65 | Asia | 880,000,000 | 2011 est. | |
| 66 | Africa | 860,000,000 | 2011 est. | |
| 67 | Africa | 752,000,000 | 2011 est. | |
| 68 | Asia | 632,000,000 | 2012 est. | |
| 69 | Europe | 508,000,000 | 2012 est. | |
| 70 | Europe | 484,700,000 | 2013 est. | |
| 71 | Asia | 424,900,000 | 2012 est. | |
| 72 | Europe | 410,000,000 | 2011 est. | |
| 73 | Europe | 373,000,000 | 2012 est. | |
| 74 | Asia | 330,200,000 | 2011 est. | |
| 75 | South America | 240,000,000 | 2011 est. | |
| 76 | Asia | 230,000,000 | 2011 est. | |
| 77 | Europe | 220,000,000 | 2011 est. | |
| 78 | Europe | 200,000,000 | 2012 est. | |
| 79 | Africa | 150,000,000 | 2011 est. | |
| 80 | Asia | 140,000,000 | 2011 est. | |
| 81 | Europe | 105,000,000 | 2012 est. | |
| 82 | Oceania | 100,000,000 | 2011 est. | |
| 83 | Africa | 70,000,000 | 2011 est. | |
| 84 | Europe | 61,000,000 | 2012 est. | |
| 85 | Africa | 60,000,000 | 2011 est. | |
| 86 | Africa | 50,000,000 | 2010 est. | |
| 87 | Caribbean | 20,000,000 | 2010 est. | |
| 88 | Africa | 20,000,000 | 2011 est. | |
| 89 | Asia | 10,000,000 | 2011 est. | |
| 90 | Europe | 10,000,000 | 2011 est. | |
| 91 | Europe | 9,151,000 | 2012 est. | |
| 92 | Europe | 6,000,000 | 2011 est. | |
| 93 | Asia | 3,928,000 | 2013 est. | |
| 94 | Europe | 2,000,000 | 2011 est. |
See also
References
- ↑ IEA. Key World Energy Statistics 2014. Natural Gas.
- ↑ Key World Statistics 2014 IEA
- ↑ Enerdata Statistical Yearbook Publication-April 2010.
- ↑ Statistical Yearbook 2010. Enerdata Publications.
- ↑ World natural gas production in 2010 — Global Energy Statistical Yearbook 2011: Enerdata, 2011
- ↑ CIA. The World Factbook. Natural gas - production.
- ↑ OPEC Statistical Bulletin 2014, [est.http://www.opec.org/library/Annual%20Statistical%20Bulletin/interactive/current/FileZ/Main.htm Marketed Natural Gas Production], accessed 19 May 2015.