North Somerset Council elections
North Somerset is a unitary authority in Somerset, England. Until 1 April 1996 it was a non-metropolitan district in Avon.
Political control
Since the first election to the council in 1973 political control of the council has been held by the following parties:[1][2]
Non-metropolitan district
| Party in control | Years | |
|---|---|---|
| Conservative | 1973-1996 | |
Unitary authority
| Party in control | Years | |
|---|---|---|
| No overall control | 1995-1996 | |
| Liberal Democrats | 1996-1999 | |
| Conservative | 1999-2003 | |
| No overall control | 2003-2007 | |
| Conservative | 2007–present | |
Council elections
Non-metropolitan district elections
- Woodspring District Council election, 1973
- Woodspring District Council election, 1976
- Woodspring District Council election, 1979 (New ward boundaries)[3]
- Woodspring District Council election, 1980
- Woodspring District Council election, 1982
- Woodspring District Council election, 1983 (District boundary changes took place but the number of seats remained the same)[4]
- Woodspring District Council election, 1984 (District boundary changes took place but the number of seats remained the same)[5]
- Woodspring District Council election, 1986
- Woodspring District Council election, 1987
- Woodspring District Council election, 1991 (District boundary changes took place but the number of seats remained the same)[6]
Unitary authority elections
- North Somerset Council election, 1995
- North Somerset Council election, 1999 (New ward boundaries increased the number of seats by 2)[7][8][9]
- North Somerset Council election, 2003
- North Somerset Council election, 2007
- North Somerset Council election, 2011 (New ward boundaries)[10]
- North Somerset Council election, 2015 (New ward boundaries)[11]
District result maps
-
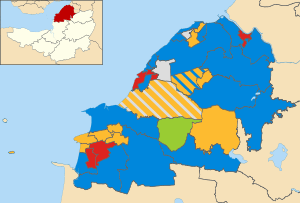
2003 results map
-
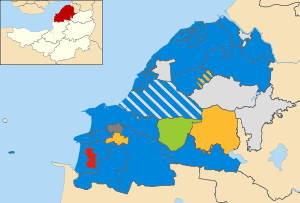
2007 results map
-
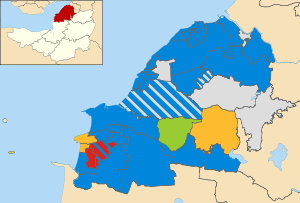
2011 results map
By-election results
1995-1999
| Party | Candidate | Votes | % | ± | |
|---|---|---|---|---|---|
| Labour | 1,232 | 58.1 | |||
| Liberal Democrat | 635 | 30.0 | |||
| Conservative | 178 | 8.4 | |||
| Independent | 74 | 3.5 | |||
| Majority | 597 | 28.1 | |||
| Turnout | 2,119 | 35.8 | |||
| Labour hold | Swing | ||||
1999-2003
| Party | Candidate | Votes | % | ± | |
|---|---|---|---|---|---|
| Conservative | Ian Porter | 279 | 32.7 | -20.9 | |
| Liberal Democrat | Michael Bibb | 229 | 26.8 | -3.0 | |
| Independent | Anthony Horry | 196 | 23.0 | +23.0 | |
| Labour | Stephen Lyall | 149 | 17.5 | +1.0 | |
| Majority | 50 | 5.9 | |||
| Turnout | 853 | 36.0 | |||
| Conservative hold | Swing | ||||
| Party | Candidate | Votes | % | ± | |
|---|---|---|---|---|---|
| Liberal Democrat | Mike Bell | 811 | 44.4 | +8.2 | |
| Conservative | Clive Webb | 651 | 35.9 | -9.0 | |
| Independent | Malcolm Timmis | 205 | 11.2 | +11.2 | |
| Labour | Chris Belton-Reed | 161 | 8.8 | -10.7 | |
| Majority | 160 | 8.5 | |||
| Turnout | 1,828 | 25.4 | |||
| Liberal Democrat gain from Conservative | Swing | ||||
| Party | Candidate | Votes | % | ± | |
|---|---|---|---|---|---|
| Liberal Democrat | Peter Kehoe | 593 | 29.2 | -4.7 | |
| Conservative | Stanley Vyce | 534 | 26.3 | +6.7 | |
| Independent | Ralph James | 496 | 24.4 | -10.7 | |
| Labour | Douglas May | 410 | 20.2 | +8.8 | |
| Majority | 59 | 2.9 | |||
| Turnout | 2,033 | 29.2 | |||
| Liberal Democrat hold | Swing | ||||
2003-2007
| Party | Candidate | Votes | % | ± | |
|---|---|---|---|---|---|
| Conservative | Carl Francis-Pester | 431 | 44.3 | -17.1 | |
| Liberal Democrat | Wendy Griggs | 369 | 37.9 | +15.0 | |
| Labour | Derek Waters | 174 | 17.9 | +2.2 | |
| Majority | 62 | 6.4 | |||
| Turnout | 974 | 44.0 | |||
| Conservative hold | Swing | ||||
| Party | Candidate | Votes | % | ± | |
|---|---|---|---|---|---|
| Liberal Democrat | Michael Johnston | 476 | 43.8 | +4.0 | |
| Conservative | David Pasley | 434 | 39.9 | -20.3 | |
| UKIP | Anthony Butcher | 118 | 10.8 | +10.8 | |
| Labour | 59 | 5.4 | +5.4 | ||
| Majority | 42 | 3.9 | |||
| Turnout | 1,087 | 45.5 | |||
| Liberal Democrat gain from Conservative | Swing | ||||
| Party | Candidate | Votes | % | ± | |
|---|---|---|---|---|---|
| Conservative | David Jolley | 488 | 38.9 | +20.8 | |
| Liberal Democrat | Jean Lord | 452 | 36.1 | +36.1 | |
| Labour | Patricia Gardener | 205 | 16.4 | +16.4 | |
| Independent | Reyna Knight | 108 | 8.6 | -73.3 | |
| Majority | 36 | 2.8 | |||
| Turnout | 1,253 | 49.0 | |||
| Conservative gain from Independent | Swing | ||||
| Party | Candidate | Votes | % | ± | |
|---|---|---|---|---|---|
| Liberal Democrat | Wendy Griggs | 812 | 31.1 | +1.3 | |
| Independent | Anthony Moulin | 749 | 28.7 | -5.8 | |
| Conservative | Jill Iles | 678 | 26.0 | +3.5 | |
| Independent | Hilary Burn | 267 | 10.2 | +10.2 | |
| Labour | Bryan Moore | 104 | 4.0 | -9.1 | |
| Majority | 63 | 2.4 | |||
| Turnout | 2,610 | 38.4 | |||
| Liberal Democrat gain from Independent | Swing | ||||
| Party | Candidate | Votes | % | ± | |
|---|---|---|---|---|---|
| Independent | Nanette Kirsen | 360 | 33.9 | +33.9 | |
| Labour | Pauline Robertson | 353 | 33.2 | -28.0 | |
| Liberal Democrat | David Neale | 202 | 19.0 | +3.4 | |
| Conservative | Anne-Marie Gregory | 147 | 13.8 | -9.3 | |
| Majority | 7 | 0.7 | |||
| Turnout | 1,062 | 40.0 | |||
| Independent gain from Labour | Swing | ||||
2007-2011
| Party | Candidate | Votes | % | ± | |
|---|---|---|---|---|---|
| Conservative | Philip Judd | 946 | |||
| Conservative | Steven Edwards | 920 | |||
| Conservative | Marcia Pepperall | 904 | |||
| Liberal Democrat | Ronald Moon | 513 | |||
| Liberal Democrat | Richard Skinner | 498 | |||
| Liberal Democrat | Peter Hardaway | 494 | |||
| Labour | Barbara Francis | 268 | |||
| Labour | Brian Grace | 234 | |||
| Labour | Simon Stokes | 218 | |||
| Independent | Laurence Orme | 157 | |||
| UKIP | Mary Brown | 154 | |||
| Turnout | 5,306 | 26.6 | |||
| Conservative gain from Liberal Democrat | Swing | ||||
| Conservative gain from Liberal Democrat | Swing | ||||
| Conservative gain from Liberal Democrat | Swing | ||||
| Party | Candidate | Votes | % | ± | |
|---|---|---|---|---|---|
| Conservative | Amratlal Patel | 478 | 27.5 | -33.6 | |
| Independent | John Ley-Morgan | 477 | 27.5 | +27.5 | |
| Liberal Democrat | Paula Howell | 421 | 24.3 | -4.1 | |
| Independent | Sidney Carter | 228 | 13.1 | +13.1 | |
| Labour | Josephine Bateman | 132 | 7.6 | -2.9 | |
| Majority | 1 | 0.1 | |||
| Turnout | 1,736 | 24.6 | |||
| Conservative hold | Swing | ||||
| Party | Candidate | Votes | % | ± | |
|---|---|---|---|---|---|
| Conservative | Terence Porter | 1,411 | 64.9 | -4.2 | |
| Liberal Democrat | Jennifer Bindon | 511 | 23.5 | +2.8 | |
| Labour | Timothy Taylor | 253 | 11.6 | +1.4 | |
| Majority | 900 | 41.4 | |||
| Turnout | 2,175 | 42.7 | |||
| Conservative hold | Swing | ||||
2011-2015
| Party | Candidate | Votes | % | ± | |
|---|---|---|---|---|---|
| Independent | Geoff Coombs | 816 | 61.7 | ||
| Conservative | Peter Burden | 314 | 23.7 | ||
| Labour | Terry Connell | 124 | 9.4 | ||
| Liberal Democrat | Nick Alderton | 69 | 5.2 | ||
| Majority | 502 | 37.9 | |||
| Turnout | 1,323 | 28.3 | |||
| Independent hold | Swing | ||||
References
- ↑ "Council compositions". The Elections Centre. Retrieved 3 May 2016.
- ↑ "England council elections". BBC News Online. Retrieved 14 August 2011.
- ↑ The District of Woodspring (Electoral Arrangements) Order 1977
- ↑ The Avon and Somerset (Areas) Order 1983
- ↑ The Bristol, Wansdyke and Woodspring (Areas) Order 1984
- ↑ legislation.gov.uk - The Avon, Somerset and Wiltshire (County Boundaries) Order 1990. Retrieved on 5 November 2015.
- ↑ legislation.gov.uk - The District of North Somerset (Electoral Changes) Order 1998. Retrieved on 4 October 2015.
- ↑ "North Somerset". BBC News Online. Retrieved 14 August 2011.
- ↑ "Political and committee structure". North Somerset Council. Retrieved 14 August 2011.
- ↑ legislation.gov.uk - The North Somerset (Electoral Changes) Order 2010. Retrieved on 3 November 2015.
- ↑ legislation.gov.uk - The North Somerset (Electoral Changes) Order 2014. Retrieved on 3 November 2015.
- ↑ "Kewstoke By-Election Result". North Somerset Council. Archived from the original on 2003-08-17. Retrieved 14 August 2011.
- ↑ "Weston By Election Result". North Somerset Council. Archived from the original on 2003-07-08. Retrieved 14 August 2011.
- ↑ "Tories win Richmondshire". guardian.co.uk. 26 October 2001. Retrieved 14 August 2011.
- ↑ "Sons of Cornwall make sole byelection gain". guardian.co.uk. 12 November 2004. Retrieved 14 August 2011.
- 1 2 "Tories make byelection gains". guardian.co.uk. 2 June 2006. Retrieved 14 August 2011.
- ↑ "Labour slumps in council byelections". guardian.co.uk. 8 September 2006. Retrieved 14 August 2011.
- ↑ "Declaration of result of poll" (PDF). North Somerset District Council. Retrieved 14 August 2011.
- ↑ "Declaration of result of poll" (PDF). North Somerset Council. Retrieved 14 August 2011.
- ↑ "Election results". North Somerset Council. Retrieved 14 August 2011.
- ↑ "Elections and voting". North Somerset Council. Retrieved 9 September 2011.
External links
| Somerset County Council | |
|---|---|
| Bath and North East Somerset Council | |
| Mendip District Council |
|
| North Somerset Council | |
| Sedgemoor District Council | |
| South Somerset District Council |
|
| Taunton Deane Borough Council | |
| West Somerset District Council | |
| Avon County Council |
|
| Bath City Council |
|
| Wansdyke District Council |
|
| |
This article is issued from Wikipedia - version of the 9/8/2016. The text is available under the Creative Commons Attribution/Share Alike but additional terms may apply for the media files.