Scottish local elections, 1988
| | |||||||||||||||||||||||||||||||||||||||||||||||||||||||||||||||||
| |||||||||||||||||||||||||||||||||||||||||||||||||||||||||||||||||
| |||||||||||||||||||||||||||||||||||||||||||||||||||||||||||||||||
|
| |||||||||||||||||||||||||||||||||||||||||||||||||||||||||||||||||
| Colours denote the winning party with outright control | |||||||||||||||||||||||||||||||||||||||||||||||||||||||||||||||||
.jpg)
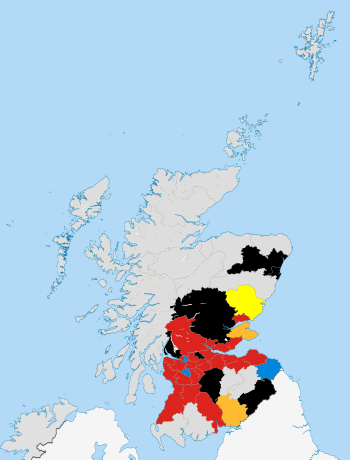
Local elections were held in Scotland on 5 May 1988, to elect members to all 53 district councils under the Local Government (Scotland) Act 1973, which had established the two-tier system of regions and districts.
National results
Summary of the 1988 Scottish district council election results[1]
| Parties | Votes | Votes % | Wards | |
|---|---|---|---|---|
| Labour | 42.6 | 553 | ||
| SNP | 21.3 | 113 | ||
| Conservative | 19.4 | 162 | ||
| Liberal Democrats | 8.4 | 84 | ||
| Independent | 6.4 | 231 | ||
| Other | ||||
| Total | n/a | ~1158 | ||
Results by council area
Borders
| Council | 1984 result | National control |
1988 result | Turnout | Details | ||
|---|---|---|---|---|---|---|---|
| Berwickshire | Conservative | Conservative | |||||
| Ettrick and Lauderdale | Independent | Independent | |||||
| Roxburghshire | Independent | Independent | |||||
| Tweeddale | Independent | Independent | |||||
Central
| Council | 1984 result | National control |
1988 result | Turnout | Details | ||
|---|---|---|---|---|---|---|---|
| Clackmannanshire | Labour | Labour | |||||
| Falkirk | Labour | Labour | |||||
| Stirling | Labour | Labour | |||||
Dumfries and Galloway
| Council | 1984 result | National control |
1988 result | Turnout | Details | ||
|---|---|---|---|---|---|---|---|
| Annandale and Eskdale | Independent | Liberal Democrat | |||||
| Merrick | Independent | Independent | |||||
| Nithsdale | Independent | Labour | |||||
| Stewartry of Kirkcudbright | Independent | Independent} | |||||
Fife
| Council | 1984 result | National control |
1998 result | Turnout | Details | ||
|---|---|---|---|---|---|---|---|
| Dunfermline | Labour | Labour | |||||
| Kirkcaldy | Labour | Labour | |||||
| North-East Fife | Liberal Democrat | Liberal Democrat | |||||
Grampian
| Council | 1984 result | National control |
1988 result | Turnout | Details | ||
|---|---|---|---|---|---|---|---|
| Banff and Buchan | Independent | Independent | |||||
| City of Aberdeen | Labour | No overall control | |||||
| Gordon | Independent | No overall control | |||||
| Kincardine and Deeside | Independent | Independent | |||||
| Moray | Independent | Independent | |||||
Highland
| Council | 1984 result | National control |
1988 result | Turnout | Details | ||
|---|---|---|---|---|---|---|---|
| Badenoch and Strathspey | Independent | Independent | |||||
| Caithness | Independent | Independent | |||||
| Inverness | Independent | Independent | |||||
| Lochaber | Independent | Independent | |||||
| Nairn | Independent | Independent | |||||
| Ross and Cromarty | Independent | Independent | |||||
| Skye and Lochalsh | Independent | Independent | |||||
| Sutherland | Independent | Independent | |||||
Lothian
| Council | 1984 result | National control |
1988 result | Turnout | Details | ||
|---|---|---|---|---|---|---|---|
| City of Edinburgh | Labour | Labour | Details | ||||
| East Lothian | Labour | Labour | |||||
| Midlothian | Labour | Labour | |||||
| West Lothian | Labour | Labour | |||||
Strathclyde
Tayside
| Council | Labour | Conservative | SNP | Liberal & SDP | Independent | Others | Control | |
|---|---|---|---|---|---|---|---|---|
| Angus | 0 | 6(-2) | 13(+2) | 1 (+1) | 1(-1) | 0 | SNP hold | |
| City of Dundee | Labour hold | |||||||
| Perth and Kinross | Conservatives lose to NOC | |||||||
References
| Scottish elections | |
|---|---|
| UK elections |
|
| Local elections | |
| Referendums | |
| Local referendums | |
| |
| Metropolitan boroughs |
|
|---|---|
| District councils (England) |
|
| District councils (Scotland) |
|
This article is issued from Wikipedia - version of the 2/1/2016. The text is available under the Creative Commons Attribution/Share Alike but additional terms may apply for the media files.