Sunderland North (UK Parliament constituency)
Coordinates: 54°55′16″N 1°22′26″W / 54.921°N 1.374°W
| Sunderland North | |
|---|---|
|
Former Borough constituency for the House of Commons | |
|
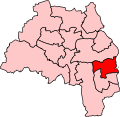
Boundary of Sunderland North in Tyne and Wear for the 2005 general election. | |
|
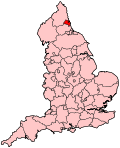
Location of Tyne and Wear within England. | |
| County | Tyne and Wear |
| Major settlements | Sunderland |
| 1950–2010 | |
| Number of members | One |
| Replaced by | Sunderland Central |
Sunderland North was a borough constituency represented in the House of Commons of the Parliament of the United Kingdom. It elected one Member of Parliament (MP) by the first past the post system of election.
History
The constituency was created in 1950 and abolished in 2010. It was considered to be a safe seat for the Labour Party throughout its existence.
Boundaries
1950-1974: The County Borough of Sunderland wards of Bridge, Central, Colliery, Deptford, Fulwell, Monkwearmouth, Monkwearmouth Shore, Roker, and Southwick.
1974-1983: The County Borough of Sunderland wards of Castletown, Central, Colliery, Deptford, Downhill, Ford, Fulwell, Hylton Castle, Monkwearmouth, Pallion, Roker, and Southwick.
1983-1997: The Metropolitan Borough of Sunderland wards of Castletown, Central, Colliery, Fulwell, Pallion, St Peter's, South Hylton, Southwick, and Town End Farm.
1997-2010: The City of Sunderland wards of Castletown, Central, Colliery, Fulwell, Pallion, St Peter's, Southwick, and Town End Farm.
Sunderland North, as can be inferred from the name, formed the northern part of the City of Sunderland. At the 2010 general election, it was replaced largely by the new constituency of Sunderland Central.
Members of Parliament
| Election | Member[1] | Party | |
|---|---|---|---|
| 1950 | Fred Willey | Labour | |
| 1983 | Bob Clay | Labour | |
| 1992 | Bill Etherington | Labour | |
| 2010 | Constituency abolished: see Sunderland Central | ||
Elections
Elections in the 1950s
| Party | Candidate | Votes | % | ± | |
|---|---|---|---|---|---|
| Labour | Fred Willey | 24,816 | 54.1 | N/A | |
| Conservative | S. Hudson | 17,469 | 38.1 | N/A | |
| Liberal | James Hurst | 3,614 | 7.9 | N/A | |
| Majority | 7,347 | 16.0 | N/A | ||
| Turnout | 45,899 | 84.4 | N/A | ||
| Labour win (new seat) | |||||
| Party | Candidate | Votes | % | ± | |
|---|---|---|---|---|---|
| Labour | Fred Willey | 23,792 | 54.0 | −0.1 | |
| Conservative | Ronald Kendall | 20,302 | 46.0 | +7.9 | |
| Majority | 3,490 | 7.9 | |||
| Turnout | 44,094 | 72.3 | −12.1 | ||
| Labour hold | Swing | −4.0 | |||
| Party | Candidate | Votes | % | ± | |
|---|---|---|---|---|---|
| Labour | Fred Willey | 24,237 | 53.1 | −0.9 | |
| Conservative | Auberon M. Herbert | 21,401 | 46.9 | +0.9 | |
| Majority | 2,836 | 6.2 | |||
| Turnout | 45,638 | 75.7 | +3.4 | ||
| Labour hold | Swing | −0.9 | |||
| Party | Candidate | Votes | % | ± | |
|---|---|---|---|---|---|
| Labour | Fred Willey | 24,341 | 52.4 | −0.7 | |
| Conservative | Philip E. Heselton | 22,133 | 47.6 | +0.7 | |
| Majority | 2,208 | 4.8 | |||
| Turnout | 46,474 | 80.5 | +4.8 | ||
| Labour hold | Swing | −0.7 | |||
Elections in the 1960s
| Party | Candidate | Votes | % | ± | |
|---|---|---|---|---|---|
| Labour | Fred Willey | 23,826 | 55.8 | +3.4 | |
| Conservative | Philip Edwin Heselton | 17,696 | 41.5 | −6.1 | |
| Independent Conservative | Robert C. Middelwood | 1,157 | 2.7 | N/A | |
| Majority | 6,130 | 14.4 | |||
| Turnout | 42,679 | 75.1 | −5.4 | ||
| Labour hold | Swing | +4.8 | |||
| Party | Candidate | Votes | % | ± | |
|---|---|---|---|---|---|
| Labour | Fred Willey | 25,438 | 60.8 | +5.0 | |
| Conservative | Peter Lewis Rost | 16,423 | 39.2 | −2.3 | |
| Majority | 9,015 | 21.5 | |||
| Turnout | 41,861 | 74.5 | −0.6 | ||
| Labour hold | Swing | +3.7 | |||
Elections in the 1970s
| Party | Candidate | Votes | % | ± | |
|---|---|---|---|---|---|
| Labour | Fred Willey | 25,779 | 60.6 | −0.2 | |
| Conservative | John M. Reay-Smith | 16,738 | 39.4 | +0.2 | |
| Majority | 9,041 | 21.3 | |||
| Turnout | 42,517 | 69.7 | −4.8 | ||
| Labour hold | Swing | −0.2 | |||
| Party | Candidate | Votes | % | ± | |
|---|---|---|---|---|---|
| Labour | Fred Willey | 28,933 | 52.2 | ||
| Conservative | John David Stuart Brown | 17,533 | 31.6 | ||
| Liberal | John Anthony Lennox | 9,015 | 16.3 | N/A | |
| Majority | 11,400 | 20.6 | |||
| Turnout | 55,481 | 74.0 | +4.3 | ||
| Labour hold | Swing | ||||
| Party | Candidate | Votes | % | ± | |
|---|---|---|---|---|---|
| Labour | Fred Willey | 29,618 | 58.5 | +6.3 | |
| Conservative | John David Stuart Brown | 13,497 | 27.5 | −4.1 | |
| Liberal | John Anthony Lennox | 7,077 | 14.0 | −2.3 | |
| Majority | 15,671 | 30.9 | |||
| Turnout | 50,642 | 67.0 | −7.0 | ||
| Labour hold | Swing | +5.2 | |||
| Party | Candidate | Votes | % | ± | |
|---|---|---|---|---|---|
| Labour | Fred Willey | 29,213 | 57.7 | −0.8 | |
| Conservative | Lindsay James Keith | 16,311 | 32.1 | +4.6 | |
| Liberal | John Anthony Lennox | 5,238 | 10.3 | −6.0 | |
| Majority | 12,902 | 25.4 | |||
| Turnout | 50,762 | 69.5 | +2.5 | ||
| Labour hold | Swing | −2.9 | |||
Elections in the 1980s
| Party | Candidate | Votes | % | ± | |
|---|---|---|---|---|---|
| Labour | Bob Clay | 24,179 | 46.3 | −11.4 | |
| Conservative | Christopher Nigel Pearson Lewis | 16,983 | 32.5 | +0.4 | |
| Liberal | Douglas McCourt | 11,090 | 21.2 | +10.9 | |
| Majority | 7,196 | 13.8 | |||
| Turnout | 52,292 | 66.5 | −3.0 | ||
| Labour hold | Swing | ||||
| Party | Candidate | Votes | % | ± | |
|---|---|---|---|---|---|
| Labour | Bob Clay | 29,767 | 55.8 | +9.5 | |
| Conservative | Iain Sutherland Pickton | 15,095 | 28.3 | −4.2 | |
| Liberal | Terence Jenkinson | 8,518 | 15.9 | −5.3 | |
| Majority | 14,672 | 27.5 | |||
| Turnout | 53,380 | 70.5 | +4.0 | ||
| Labour hold | Swing | +6.9 | |||
Elections in the 1990s
| Party | Candidate | Votes | % | ± | |
|---|---|---|---|---|---|
| Labour | Bill Etherington | 30,481 | 60.7 | +5.0 | |
| Conservative | Miss Judith Vaughan Barnes | 13,477 | 26.9 | −1.4 | |
| Liberal Democrat | Vic Halom | 5,389 | 10.7 | −5.2 | |
| Liberal | Mrs Winifred Ellen Lundgren | 841 | 1.7 | −14.3 | |
| Majority | 17,004 | 33.9 | +6.4 | ||
| Turnout | 50,188 | 68.9 | −1.7 | ||
| Labour hold | Swing | +3.2 | |||
| Party | Candidate | Votes | % | ± | |
|---|---|---|---|---|---|
| Labour | Bill Etherington | 26,067 | 68.2 | +8.6 | |
| Conservative | Andrew Selous | 6,370 | 16.7 | −11.1 | |
| Liberal Democrat | Geoffrey Michael Pryke | 3,973 | 10.4 | −0.6 | |
| Referendum | Mark Thomas Nicholson | 1,394 | 3.6 | N/A | |
| Monster Raving Loony | Kenneth James Newby | 409 | 1.1 | N/A | |
| Majority | 19,697 | 51.5 | |||
| Turnout | 38,213 | 59.1 | −9.8 | ||
| Labour hold | Swing | ||||
Elections in the 2000s
| Party | Candidate | Votes | % | ± | |
|---|---|---|---|---|---|
| Labour | Bill Etherington | 18,685 | 62.7 | −5.6 | |
| Conservative | Michael Ross Harris | 5,331 | 17.9 | +1.2 | |
| Liberal Democrat | John Anthony Lennox | 3,599 | 12.1 | +1.7 | |
| Independent | Neil Andrew Herron | 1,518 | 5.1 | N/A | |
| BNP | David Edward Guynan | 687 | 2.3 | N/A | |
| Majority | 13,354 | 44.8 | |||
| Turnout | 29,820 | 49.0 | −10.0 | ||
| Labour hold | Swing | ||||
| Party | Candidate | Votes | % | ± | |
|---|---|---|---|---|---|
| Labour | Bill Etherington | 15,719 | 54.4 | −8.3 | |
| Conservative | Stephen Daughton | 5,724 | 19.8 | +1.9 | |
| Liberal Democrat | James Hollern | 4,277 | 14.8 | +2.7 | |
| Independent | Neil Andrew Herron | 2,057 | 7.1 | +2.0 | |
| BNP | Miss Debra Hiles | 1,136 | 3.9 | +1.6 | |
| Majority | 9,995 | 34.6 | |||
| Turnout | 28,913 | 49.7 | +0.7 | ||
| Labour hold | Swing | −5.1 | |||
See also
Notes and references
- ↑ Leigh Rayment's Historical List of MPs – Constituencies beginning with "S" (part 6)
- ↑ "Politics Resources". Election 1992. Politics Resources. 9 April 1992. Retrieved 6 Dec 2010.