United States House of Representatives elections in California, 2006
| | ||||||||||||||||||||||||||||||||||||||
| ||||||||||||||||||||||||||||||||||||||
| ||||||||||||||||||||||||||||||||||||||
|
| ||||||||||||||||||||||||||||||||||||||
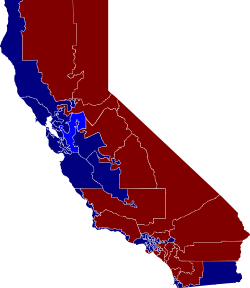
| Electoral results by congressional district Democratic hold Democratic pickup Republican hold | ||||||||||||||||||||||||||||||||||||||
| Elections in California | ||||||||||
|---|---|---|---|---|---|---|---|---|---|---|
 | ||||||||||
|
||||||||||
|
||||||||||
The United States House of Representatives elections in California, 2006 were elections for California's delegation to the United States House of Representatives, which occurred along with congressional elections nationwide and state elections on November 7, 2006. Only one district, the 11th, changed party control when Democrat Jerry McNerney defeated Republican Richard Pombo.[1][2]
Overview
| United States House of Representatives elections in California, 2006[1][2] | |||||
|---|---|---|---|---|---|
| Party | Votes | Percentage | Seats | +/– | |
| Democratic | 4,720,714 | 53.05% | 34 | +1 | |
| Republican | 3,329,485 | 37.41% | 19 | –1 | |
| Libertarian | 170,711 | 1.92% | 0 | 0 | |
| Green | 48,445 | 0.54% | 0 | 0 | |
| Peace and Freedom | 27,467 | 0.31% | 0 | 0 | |
| American Independent | 11,694 | 0.13% | 0 | 0 | |
| Independent | 2,755 | 0.03% | 0 | 0 | |
| Invalid or blank votes | 603,243 | 6.78% | — | — | |
| Totals | 8,899,059 | 100.00% | 53 | — | |
Results
The following are the final results from the Secretary of State of California.[1]
|
District 1 • District 2 • District 3 • District 4 • District 5 • District 6 • District 7 • District 8 • District 9 • District 10 • District 11 • District 12 • District 13 • District 14 • District 15 • District 16 • District 17 • District 18 • District 19 • District 20 • District 21 • District 22 • District 23 • District 24 • District 25 • District 26 • District 27 • District 28 • District 29 • District 30 • District 31 • District 32 • District 33 • District 34 • District 35 • District 36 • District 37 • District 38 • District 39 • District 40 • District 41 • District 42 • District 43 • District 44 • District 45 • District 46 • District 47 • District 48 • District 49 • District 50 • District 51 • District 52 • District 53 |
District 1
| Party | Candidate | Votes | % | |
|---|---|---|---|---|
| Democratic | Mike Thompson (incumbent) | 144,409 | 66.23 | |
| Republican | John Jones | 63,194 | 28.98 | |
| Green | Pamela Elizondo | 6,899 | 3.16 | |
| Peace and Freedom | Timothy Stock | 3,503 | 1.61 | |
| Independent | Carol Wolman (write-in) | 39 | 0.02 | |
| Total votes | 218,044 | 100.00 | ||
| Voter turnout | % | |||
| Democratic hold | ||||
District 2
| Party | Candidate | Votes | % | |
|---|---|---|---|---|
| Republican | Wally Herger (incumbent) | 134,911 | 64.18 | |
| Democratic | Arjinderpal Sekhon | 68,234 | 32.46 | |
| Libertarian | E. Kent Hinesley | 7,057 | 3.36 | |
| Total votes | 210,202 | 100.00 | ||
| Voter turnout | % | |||
| Republican hold | ||||
District 3
| Party | Candidate | Votes | % | |
|---|---|---|---|---|
| Republican | Dan Lungren (incumbent) | 135,709 | 59.48 | |
| Democratic | Bill Durston | 86,318 | 37.83 | |
| Libertarian | Douglas Tuma | 3,772 | 1.65 | |
| Peace and Freedom | Michael Roskey | 2,370 | 1.04 | |
| Total votes | 228,169 | 100.00 | ||
| Voter turnout | % | |||
| Republican hold | ||||
District 4
| Party | Candidate | Votes | % | |
|---|---|---|---|---|
| Republican | John Doolittle (incumbent) | 135,818 | 49.05 | |
| Democratic | Charles Brown | 126,999 | 45.87 | |
| Libertarian | Dan Warren | 14,076 | 5.08 | |
| Total votes | 276,893 | 100.00 | ||
| Voter turnout | % | |||
| Republican hold | ||||
District 5
| Party | Candidate | Votes | % | |
|---|---|---|---|---|
| Democratic | Doris Matsui (incumbent) | 105,676 | 70.80 | |
| Republican | Xiaochin Yan | 35,106 | 23.52 | |
| Green | Jeff Kravitz | 6,466 | 4.33 | |
| Peace and Freedom | John Reiger | 2,018 | 1.35 | |
| Total votes | 149,266 | 100.00 | ||
| Voter turnout | % | |||
| Democratic hold | ||||
District 6
| Party | Candidate | Votes | % | |
|---|---|---|---|---|
| Democratic | Lynn Woolsey (incumbent) | 173,190 | 70.22 | |
| Republican | Todd Hooper | 64,405 | 26.11 | |
| Libertarian | Richard Friesen | 9,028 | 3.66 | |
| Republican | Michael Halliwell (write-in) | 5 | 0.00 | |
| Total votes | 246,628 | 100.00 | ||
| Voter turnout | % | |||
| Democratic hold | ||||
District 7
| Party | Candidate | Votes | % | |
|---|---|---|---|---|
| Democratic | George Miller (incumbent) | 118,000 | 83.99 | |
| Libertarian | Camden McConnell | 22,486 | 16.01 | |
| Total votes | 140,486 | 100.00 | ||
| Voter turnout | % | |||
| Democratic hold | ||||
District 8
| Party | Candidate | Votes | % | |
|---|---|---|---|---|
| Democratic | Nancy Pelosi (incumbent) | 148,435 | 80.39 | |
| Republican | Mike DeNunzio | 19,800 | 10.72 | |
| Green | Krissy Keefer | 13,653 | 7.39 | |
| Libertarian | Philip Berg | 2,751 | 1.49 | |
| Total votes | 184,639 | 100.00 | ||
| Voter turnout | % | |||
| Democratic hold | ||||
District 9
| Party | Candidate | Votes | % | |
|---|---|---|---|---|
| Democratic | Barbara Lee (incumbent) | 167,245 | 86.35 | |
| Republican | John denDulk | 20,786 | 10.73 | |
| Libertarian | James Eyer | 5,655 | 2.92 | |
| Total votes | 193,686 | 100.00 | ||
| Voter turnout | % | |||
| Democratic hold | ||||
District 10
| Party | Candidate | Votes | % | |
|---|---|---|---|---|
| Democratic | Ellen Tauscher (incumbent) | 130,859 | 67.56 | |
| Republican | Darcy Linn | 66,069 | 34.11 | |
| Republican | Jeff Ketelson (write-in) | 50 | 0.03 | |
| Total votes | 196,978 | 100.00 | ||
| Voter turnout | % | |||
| Democratic hold | ||||
District 11
| Party | Candidate | Votes | % | |||
|---|---|---|---|---|---|---|
| Democratic | Jerry McNerney | 109,868 | 53.27 | |||
| Republican | Richard Pombo (incumbent) | 96,396 | 46.73 | |||
| Total votes | 206,264 | 100.00 | ||||
| Voter turnout | % | |||||
| Democratic gain from Republican | ||||||
District 12
| Party | Candidate | Votes | % | |
|---|---|---|---|---|
| Democratic | Tom Lantos (incumbent) | 138,650 | 76.05 | |
| Republican | Mike Moloney | 43,674 | 23.95 | |
| Total votes | 182,324 | 100.00 | ||
| Voter turnout | % | |||
| Democratic hold | ||||
District 13
| Party | Candidate | Votes | % | |
|---|---|---|---|---|
| Democratic | Pete Stark (incumbent) | 110,756 | 74.89 | |
| Republican | George Bruno | 37,141 | 25.11 | |
| Total votes | 147,897 | 100.00 | ||
| Voter turnout | % | |||
| Democratic hold | ||||
District 14
| Party | Candidate | Votes | % | |
|---|---|---|---|---|
| Democratic | Anna Eshoo (incumbent) | 141,153 | 71.08 | |
| Republican | Rob Smith | 48,097 | 24.22 | |
| Libertarian | Brian Holtz | 4,692 | 2.36 | |
| Green | Carol Brouillet | 4,633 | 2.33 | |
| Total votes | 198,575 | 100.00 | ||
| Voter turnout | % | |||
| Democratic hold | ||||
District 15
| Party | Candidate | Votes | % | |
|---|---|---|---|---|
| Democratic | Mike Honda (incumbent) | 115,532 | 72.33 | |
| Republican | Raymond Chukwu | 44,186 | 27.67 | |
| Total votes | 159,718 | 100.00 | ||
| Voter turnout | % | |||
| Democratic hold | ||||
District 16
| Party | Candidate | Votes | % | |
|---|---|---|---|---|
| Democratic | Zoe Lofgren (incumbent) | 98,929 | 72.71 | |
| Republican | Charel Winston | 37,130 | 27.29 | |
| Total votes | 136,059 | 100.00 | ||
| Voter turnout | % | |||
| Democratic hold | ||||
District 17
| Party | Candidate | Votes | % | |
|---|---|---|---|---|
| Democratic | Sam Farr (incumbent) | 120,750 | 75.80 | |
| Republican | Anthony De Maio | 35,932 | 22.56 | |
| Independent | Jeff Taylor (write-in) | 2,611 | 1.64 | |
| Total votes | 159,293 | 100.00 | ||
| Voter turnout | % | |||
| Democratic hold | ||||
District 18
| Party | Candidate | Votes | % | |
|---|---|---|---|---|
| Democratic | Dennis Cardoza (incumbent) | 71,182 | 65.48 | |
| Republican | John Kanno | 37,531 | 34.52 | |
| Total votes | 108,713 | 100.00 | ||
| Voter turnout | % | |||
| Democratic hold | ||||
District 19
| Party | Candidate | Votes | % | |
|---|---|---|---|---|
| Republican | George Radanovich (incumbent) | 110,246 | 60.58 | |
| Democratic | T. J. Cox | 71,748 | 39.42 | |
| Total votes | 181,994 | 100.00 | ||
| Voter turnout | % | |||
| Republican hold | ||||
District 20
| Party | Candidate | Votes | % | |
|---|---|---|---|---|
| Democratic | Jim Costa (incumbent) | 61,120 | 100.00 | |
| Total votes | 61,120 | 100.00 | ||
| Voter turnout | % | |||
| Democratic hold | ||||
District 21
| Party | Candidate | Votes | % | |
|---|---|---|---|---|
| Republican | Devin Nunes (incumbent) | 95,214 | 66.74 | |
| Democratic | Steven Haze | 42,718 | 29.94 | |
| Green | John Miller | 4,729 | 3.31 | |
| Total votes | 142,661 | 100.00 | ||
| Voter turnout | % | |||
| Republican hold | ||||
District 22
| Party | Candidate | Votes | % | |
|---|---|---|---|---|
| Republican | Kevin McCarthy | 133,278 | 70.70 | |
| Democratic | Sharon Beery | 55,226 | 29.30 | |
| Total votes | 188,504 | 100.00 | ||
| Voter turnout | % | |||
| Republican hold | ||||
District 23
| Party | Candidate | Votes | % | |
|---|---|---|---|---|
| Democratic | Lois Capps (incumbent) | 114,661 | 65.17 | |
| Republican | Victor Tognazzini | 61,272 | 34.82 | |
| Independent | H. A. Gardner (write-in) | 18 | 0.01 | |
| Total votes | 175,951 | 100.00 | ||
| Voter turnout | % | |||
| Democratic hold | ||||
District 24
| Party | Candidate | Votes | % | |
|---|---|---|---|---|
| Republican | Elton Gallegly (incumbent) | 129,812 | 62.02 | |
| Democratic | Jill Martinez | 79,461 | 37.97 | |
| Independent | Michael Stettler (write-in) | 16 | 0.01 | |
| Independent | Henry Nicolle (write-in) | 3 | 0.00 | |
| Total votes | 209,292 | 100.00 | ||
| Voter turnout | % | |||
| Republican hold | ||||
District 25
| Party | Candidate | Votes | % | |
|---|---|---|---|---|
| Republican | Howard McKeon (incumbent) | 93,987 | 59.95 | |
| Democratic | Robert Rodriguez | 55,913 | 35.66 | |
| Libertarian | David Erickson | 6,873 | 4.38 | |
| Total votes | 156,773 | 100.00 | ||
| Voter turnout | % | |||
| Republican hold | ||||
District 26
| Party | Candidate | Votes | % | |
|---|---|---|---|---|
| Republican | David Dreier (incumbent) | 102,028 | 56.95 | |
| Democratic | Cynthia Matthews | 67,878 | 37.89 | |
| Libertarian | Ted Brown | 5,887 | 3.29 | |
| American Independent | Elliott Graham | 3,351 | 1.87 | |
| Total votes | 179,144 | 100.00 | ||
| Voter turnout | % | |||
| Republican hold | ||||
District 27
| Party | Candidate | Votes | % | |
|---|---|---|---|---|
| Democratic | Brad Sherman (incumbent) | 92,650 | 68.77 | |
| Republican | Peter Hankwitz | 42,074 | 31.23 | |
| Total votes | 134,724 | 100.00 | ||
| Voter turnout | % | |||
| Democratic hold | ||||
District 28
| Party | Candidate | Votes | % | |
|---|---|---|---|---|
| Democratic | Howard Berman (incumbent) | 79,866 | 73.92 | |
| Republican | Stanley Kesselman | 20,629 | 19.09 | |
| Green | Byron De Lear | 3,868 | 3.58 | |
| Libertarian | Kelley Ross | 3,679 | 3.41 | |
| Total votes | 108,042 | 100.00 | ||
| Voter turnout | % | |||
| Democratic hold | ||||
District 29
| Party | Candidate | Votes | % | |
|---|---|---|---|---|
| Democratic | Adam Schiff (incumbent) | 91,014 | 63.47 | |
| Republican | William Bodell | 39,321 | 27.42 | |
| Green | William Paparian | 8,197 | 5.72 | |
| Peace and Freedom | Lynda Llamas | 2,599 | 1.81 | |
| Libertarian | Jim Keller | 2,258 | 1.57 | |
| Independent | John Burton (write-in) | 15 | 0.01 | |
| Total votes | 143,404 | 100.00 | ||
| Voter turnout | % | |||
| Democratic hold | ||||
District 30
| Party | Candidate | Votes | % | |
|---|---|---|---|---|
| Democratic | Henry Waxman (incumbent) | 151,284 | 71.45 | |
| Republican | David Jones | 55,904 | 26.40 | |
| Peace and Freedom | Adele Cannon | 4,546 | 2.15 | |
| Total votes | 211,734 | 100.00 | ||
| Voter turnout | % | |||
| Democratic hold | ||||
District 31
| Party | Candidate | Votes | % | |
|---|---|---|---|---|
| Democratic | Xavier Becerra (incumbent) | 64,952 | 100.00 | |
| Total votes | 64,952 | 100.00 | ||
| Voter turnout | % | |||
| Democratic hold | ||||
District 32
| Party | Candidate | Votes | % | |
|---|---|---|---|---|
| Democratic | Hilda Solis (incumbent) | 76,059 | 82.96 | |
| Libertarian | Leland Faegre | 15,627 | 17.04 | |
| Total votes | 91,686 | 100.00 | ||
| Voter turnout | % | |||
| Democratic hold | ||||
District 33
| Party | Candidate | Votes | % | |
|---|---|---|---|---|
| Democratic | Diane Watson (incumbent) | 113,715 | 100.00 | |
| Total votes | 113,715 | 100.00 | ||
| Voter turnout | % | |||
| Democratic hold | ||||
District 34
| Party | Candidate | Votes | % | |
|---|---|---|---|---|
| Democratic | Lucille Roybal-Allard (incumbent) | 57,459 | 76.92 | |
| Republican | Wayne Miller | 17,359 | 23.20 | |
| Independent | Naomi Crane (write-in) | 1 | 0.00 | |
| Total votes | 74,819 | 100.00 | ||
| Voter turnout | % | |||
| Democratic hold | ||||
District 35
| Party | Candidate | Votes | % | |
|---|---|---|---|---|
| Democratic | Maxine Waters (incumbent) | 82,498 | 83.75 | |
| American Independent | Gordon Mego | 8,343 | 8.47 | |
| Libertarian | Paul Ireland | 7,665 | 7.78 | |
| Total votes | 98,506 | 100.00 | ||
| Voter turnout | % | |||
| Democratic hold | ||||
District 36
| Party | Candidate | Votes | % | |
|---|---|---|---|---|
| Democratic | Jane Harman (incumbent) | 105,323 | 63.39 | |
| Republican | Brian Gibson | 53,068 | 31.94 | |
| Peace and Freedom | James Smith | 4,592 | 2.76 | |
| Libertarian | Mike Binkley | 3,170 | 1.91 | |
| Total votes | 166,153 | 100.00 | ||
| Voter turnout | % | |||
| Democratic hold | ||||
District 37
| Party | Candidate | Votes | % | |
|---|---|---|---|---|
| Democratic | Juanita Millender-McDonald (inc.) | 80,716 | 82.40 | |
| Libertarian | Herb Peters | 17,246 | 17.60 | |
| Total votes | 97,962 | 100.00 | ||
| Voter turnout | % | |||
| Democratic hold | ||||
District 38
| Party | Candidate | Votes | % | |
|---|---|---|---|---|
| Democratic | Grace Napolitano (incumbent) | 75,181 | 75.33 | |
| Republican | Sidney Street | 24,620 | 24.67 | |
| Total votes | 99,801 | 100.00 | ||
| Voter turnout | % | |||
| Democratic hold | ||||
District 39
| Party | Candidate | Votes | % | |
|---|---|---|---|---|
| Democratic | Linda Sánchez (incumbent) | 72,149 | 65.87 | |
| Republican | James Andion | 37,384 | 34.13 | |
| Total votes | 109,533 | 100.00 | ||
| Voter turnout | % | |||
| Democratic hold | ||||
District 40
| Party | Candidate | Votes | % | |
|---|---|---|---|---|
| Republican | Ed Royce (incumbent) | 100,995 | 66.76 | |
| Democratic | Florice Hoffman | 46,418 | 30.68 | |
| Libertarian | Philip Inman | 3,876 | 2.56 | |
| Total votes | 151,289 | 100.00 | ||
| Voter turnout | % | |||
| Republican hold | ||||
District 41
| Party | Candidate | Votes | % | |
|---|---|---|---|---|
| Republican | Jerry Lewis (incumbent) | 109,761 | 66.91 | |
| Democratic | Louie Contreras | 54,235 | 33.06 | |
| Independent | Carol Petersen (write-in) | 48 | 0.03 | |
| Total votes | 164,044 | 100.00 | ||
| Voter turnout | % | |||
| Republican hold | ||||
District 42
| Party | Candidate | Votes | % | |
|---|---|---|---|---|
| Republican | Gary Miller (incumbent) | 129,720 | 100.00 | |
| Total votes | 129,720 | 100.00 | ||
| Voter turnout | % | |||
| Republican hold | ||||
District 43
| Party | Candidate | Votes | % | |
|---|---|---|---|---|
| Democratic | Joe Baca (incumbent) | 52,791 | 64.49 | |
| Republican | Scott Folkens | 29,069 | 35.51 | |
| Total votes | 81,860 | 100.00 | ||
| Voter turnout | % | |||
| Democratic hold | ||||
District 44
| Party | Candidate | Votes | % | |
|---|---|---|---|---|
| Republican | Ken Calvert (incumbent) | 89,555 | 59.98 | |
| Democratic | Louis Vandenburg | 55,275 | 37.02 | |
| Peace and Freedom | Kevin Akin | 4,486 | 3.00 | |
| Total votes | 149,316 | 100.00 | ||
| Voter turnout | % | |||
| Republican hold | ||||
District 45
| Party | Candidate | Votes | % | |
|---|---|---|---|---|
| Republican | Mary Bono (incumbent) | 99,638 | 60.66 | |
| Democratic | David Roth | 64,613 | 39.34 | |
| Total votes | 164,251 | 100.00 | ||
| Voter turnout | % | |||
| Republican hold | ||||
District 46
| Party | Candidate | Votes | % | |
|---|---|---|---|---|
| Republican | Dana Rohrabacher (incumbent) | 116,176 | 59.56 | |
| Democratic | Jim Brandt | 71,573 | 36.69 | |
| Libertarian | Dennis Chang | 7,303 | 3.74 | |
| Total votes | 195,052 | 100.00 | ||
| Voter turnout | % | |||
| Republican hold | ||||
District 47
| Party | Candidate | Votes | % | |
|---|---|---|---|---|
| Democratic | Loretta Sanchez (incumbent) | 47,134 | 62.33 | |
| Republican | Tan Nguyen | 28,485 | 37.67 | |
| Total votes | 75,619 | 100.00 | ||
| Voter turnout | % | |||
| Democratic hold | ||||
District 48
| Party | Candidate | Votes | % | |
|---|---|---|---|---|
| Republican | John Campbell (incumbent) | 120,130 | 59.91 | |
| Democratic | Steve Young | 74,647 | 37.23 | |
| Libertarian | Bruce Cohen | 5,750 | 2.87 | |
| Total votes | 200,527 | 100.00 | ||
| Voter turnout | % | |||
| Republican hold | ||||
District 49
| Party | Candidate | Votes | % | |
|---|---|---|---|---|
| Republican | Darrell Issa (incumbent) | 98,831 | 63.30 | |
| Democratic | Jeeni Criscenzo | 52,227 | 33.45 | |
| Libertarian | Lars Grossmith | 4,952 | 3.17 | |
| Democratic | Frank Ford (write-in) | 127 | 0.08 | |
| Total votes | 156,137 | 100.00 | ||
| Voter turnout | % | |||
| Republican hold | ||||
District 50
| Party | Candidate | Votes | % | |
|---|---|---|---|---|
| Republican | Brian Bilbray (incumbent) | 118,018 | 53.14 | |
| Democratic | Francine Busby | 96,612 | 43.50 | |
| Libertarian | Paul King | 4,119 | 1.85 | |
| Peace and Freedom | Miriam Clark | 3,353 | 1.51 | |
| Total votes | 222,102 | 100.00 | ||
| Voter turnout | % | |||
| Republican hold | ||||
District 51
| Party | Candidate | Votes | % | |
|---|---|---|---|---|
| Democratic | Bob Filner (incumbent) | 78,114 | 67.43 | |
| Republican | Blake Miles | 34,931 | 30.15 | |
| Libertarian | Dan Litwin | 2,790 | 2.41 | |
| Independent | David Arguello (write-in) | 4 | 0.00 | |
| Total votes | 115,839 | 100.00 | ||
| Voter turnout | % | |||
| Democratic hold | ||||
District 52
| Party | Candidate | Votes | % | |
|---|---|---|---|---|
| Republican | Duncan Hunter (incumbent) | 123,696 | 64.64 | |
| Democratic | John Rinaldi | 61,208 | 32.16 | |
| Libertarian | Michael Benoit | 6,465 | 3.38 | |
| Total votes | 191,369 | 100.00 | ||
| Voter turnout | % | |||
| Republican hold | ||||
District 53
| Party | Candidate | Votes | % | |
|---|---|---|---|---|
| Democratic | Susan Davis (incumbent) | 97,541 | 67.55 | |
| Republican | John Woodrum | 43,312 | 30.00 | |
| Libertarian | Ernie Lippe | 3,534 | 2.45 | |
| Total votes | 144,387 | 100.00 | ||
| Voter turnout | % | |||
| Democratic hold | ||||
See also
- 110th United States Congress
- Political party strength in California
- Political party strength in U.S. states
- United States House of Representatives elections, 2006
References
- 1 2 3 "Congress" (PDF). Secretary of State of California. 2006-12-16. Archived from the original (PDF) on November 15, 2012. Retrieved 2008-08-10.
- 1 2 "Registration and Participation" (PDF). Secretary of State of California. 2006-12-18. Retrieved 2008-07-16.
External links
- California Legislative District Maps (1911-Present)
- RAND California Election Returns: District Definitions