Wakefield Metropolitan District Council election, 2011
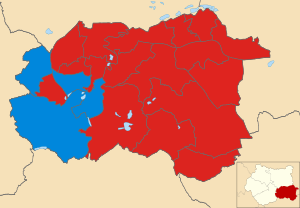
2011 local election results in Wakefield
The 2011 Wakefield Metropolitan District Council election took place on 5 May 2011 to elect members of Wakefield Metropolitan District Council in West Yorkshire, England. One third of the council was up for election and the Labour party stayed in overall control of the council with an increased majority.[1] After the election, the composition of the council was:
| Party | Seats | Current Council (2011) | |||||||||||||||||||||||||||||||||||||||||||||||||||||||||||||||||
|---|---|---|---|---|---|---|---|---|---|---|---|---|---|---|---|---|---|---|---|---|---|---|---|---|---|---|---|---|---|---|---|---|---|---|---|---|---|---|---|---|---|---|---|---|---|---|---|---|---|---|---|---|---|---|---|---|---|---|---|---|---|---|---|---|---|---|---|
| 2008 | 2010 | 2011 | |||||||||||||||||||||||||||||||||||||||||||||||||||||||||||||||||
| Labour | 32 | 34 | 39 | ||||||||||||||||||||||||||||||||||||||||||||||||||||||||||||||||
| Conservative | 23 | 23 | 21 | ||||||||||||||||||||||||||||||||||||||||||||||||||||||||||||||||
| Independent | 6 | 5 | 3 | ||||||||||||||||||||||||||||||||||||||||||||||||||||||||||||||||
| Lib Dems | 2 | 1 | 0 | ||||||||||||||||||||||||||||||||||||||||||||||||||||||||||||||||
Election result
| Wakefield Local Election Result 2011 | ||||||||||
|---|---|---|---|---|---|---|---|---|---|---|
| Party | Seats | Gains | Losses | Net gain/loss | Seats % | Votes % | Votes | +/− | ||
| Labour | 17 | 5 | 0 | +5 | 81 | 55.8 | 49,995 | +12.8 | ||
| Conservative | 4 | 1 | 3 | -2 | 19 | 29.9 | 26,752 | +0.9 | ||
| Liberal Democrat | 0 | 0 | 1 | -1 | 0 | 5.0 | 4,439 | -7 | ||
| Independent | 0 | 0 | 2 | -2 | 0 | 3.5 | 3,105 | -3.5 | ||
| UKIP | 0 | 0 | 0 | 0 | 0 | 3.1 | 2,821 | +3 | ||
| Green | 0 | 0 | 0 | 0 | 0 | 0.9 | 831 | |||
| BNP | 0 | 0 | 0 | 0 | 0 | 0.8 | 759 | -8 | ||
| Socialist Alternative | 0 | 0 | 0 | 0 | 0 | 0.3 | 305 | |||
- 0.7% of ballots were spoilt
Ward results
Ackworth, North Elmsall and Upton ward
| Party | Candidate | Votes | % | ± | |
|---|---|---|---|---|---|
| Labour | Jean Askew | 2,484 | 52.2 | +14.6 | |
| Conservative | Don Marshall | 1,643 | 34.6 | +4.7 | |
| BNP | Ian Kitchen | 318 | 6.7 | -2.4 | |
| Liberal Democrat | David Arthur | 285 | 6.0 | -7 | |
| Majority | 841 | 17.7 | +10.6 | ||
| Turnout | 4,755 | 37.5 | -25.5 | ||
| Labour hold | Swing | ||||
Airedale and Ferry Fryston ward
| Party | Candidate | Votes | % | ± | |
|---|---|---|---|---|---|
| Labour | Yvonne Crewe | 2,611 | 80.1 | +24.4 | |
| Conservative | Mellisa Wan Omer | 627 | 19.2 | +7.1 | |
| Majority | 1,984 | 60.9 | +22.2 | ||
| Turnout | 3,258 | 28.2 | -23.4 | ||
| Labour hold | Swing | ||||
Altofts and Whitwood ward
| Party | Candidate | Votes | % | ± | |
|---|---|---|---|---|---|
| Labour | Heather Hudson | 2,582 | 64.1 | +17.9 | |
| Conservative | Steven Beeton | 1,009 | 25.1 | +3.8 | |
| Liberal Democrat | Michael Burch | 404 | 10.0 | -10.9 | |
| Majority | 1,573 | 39.1 | +14.2 | ||
| Turnout | 4,027 | 32.2 | -27.5 | ||
| Labour hold | Swing | ||||
Castleford Central and Glasshoughton ward
| Party | Candidate | Votes | % | ± | |
|---|---|---|---|---|---|
| Labour | Tony Wallis | 2,641 | 74.2 | +11.1 | |
| UKIP | Alison Bullivant | 477 | 13.4 | +13.4 | |
| Conservative | Eamonn Mullins | 426 | 12 | -6.4 | |
| Majority | 2,164 | 60.8 | +16.1 | ||
| Turnout | 3,558 | 54.5 | -24.9 | ||
| Labour hold | Swing | ||||
Crofton, Ryhill and Walton ward
| Party | Candidate | Votes | % | ± | |
|---|---|---|---|---|---|
| Labour | Maureen Cummings | 2,954 | 61.2 | +21.3 | |
| Conservative | Jane Brown | 1,446 | 30.0 | +1 | |
| Liberal Democrat | Christopher Pilkington | 403 | 8.3 | -7.6 | |
| Majority | 1,508 | 31.2 | +20.4 | ||
| Turnout | 4,827 | 39.7 | -25.7 | ||
| Labour hold | Swing | ||||
Featherstone ward
| Party | Candidate | Votes | % | ± | |
|---|---|---|---|---|---|
| Labour | Graham Isherwood | 2,707 | 62.3 | +6.3 | |
| Independent | Steve Vickers | 1,093 | 25.1 | +4.4 | |
| Conservative | June Harrison | 516 | 11.9 | -1.1 | |
| Majority | 1,614 | 37.1 | +1.8 | ||
| Turnout | 4,347 | 34.4 | -21.8 | ||
| Labour gain from Independent | Swing | ||||
Hemsworth ward
| Party | Candidate | Votes | % | ± | |
|---|---|---|---|---|---|
| Labour | Glyn Lloyd | 2,322 | 59.5 | +4.8 | |
| Independent | Raymond Warren | 1,078 | 27.6 | +7.4 | |
| Conservative | Philip Davies | 471 | 12.1 | -2.1 | |
| Majority | 1,244 | 31.9 | -2.6 | ||
| Turnout | 3,902 | 32.9 | -23.7 | ||
| Labour hold | Swing | ||||
Horbury and South Ossett ward
| Party | Candidate | Votes | % | ± | |
|---|---|---|---|---|---|
| Labour | Brian Holmes | 2,433 | 48.7 | +12.4 | |
| Conservative | Alyson Ripley | 2,048 | 41.0 | +3.4 | |
| Liberal Democrat | Mark Goodair | 473 | 9.5 | -9.3 | |
| Majority | 385 | 7.7 | |||
| Turnout | 4,998 | 41.4 | -25.7 | ||
| Labour gain from Conservative | Swing | ||||
Knottingley ward
| Party | Candidate | Votes | % | ± | |
|---|---|---|---|---|---|
| Labour | Glenn Burton | 1,803 | 57.5 | +1.6 | |
| Conservative | Jon Wadey | 493 | 15.7 | -9.2 | |
| Independent | Jack Wright | 486 | 15.5 | +15.5 | |
| UKIP | Nathan Garbutt | 336 | 10.7 | +10.7 | |
| Majority | 1,319 | 41.8 | +10.8 | ||
| Turnout | 3,135 | 29.5 | -22.7 | ||
| Labour hold | Swing | ||||
Normanton ward
| Party | Candidate | Votes | % | ± | |
|---|---|---|---|---|---|
| Labour | David Dagger | 2,266 | 63.9 | +16.9 | |
| Conservative | Jean Molloy | 649 | 18.3 | -2.2 | |
| UKIP | Bryan Barkley | 613 | 17.3 | +17.3 | |
| Majority | 1,617 | 45.6 | +19.1 | ||
| Turnout | 3,546 | 28.5 | -25.1 | ||
| Labour hold | Swing | ||||
Ossett ward
| Party | Candidate | Votes | % | ± | |
|---|---|---|---|---|---|
| Conservative | Angela Taylor | 2,178 | 43.1 | +8 | |
| Labour | Tony Richardson | 2,039 | 40.3 | +11.6 | |
| Liberal Democrat | David Smith | 801 | 15.8 | -12 | |
| Majority | 139 | 2.7 | |||
| Turnout | 5,055 | 39.7 | -26.5 | ||
| Conservative gain from Liberal Democrat | Swing | ||||
Pontefract North ward
| Party | Candidate | Votes | % | ± | |
|---|---|---|---|---|---|
| Labour | Pat Garbutt | 2,261 | 59.8 | +14.2 | |
| Conservative | Chris Speight | 894 | 23.6 | -0.2 | |
| UKIP | Justin Hudson | 403 | 10.7 | +10.7 | |
| Green | Rennie Smith | 205 | 5.4 | +3.2 | |
| Majority | 1,367 | 36.1 | +14.3 | ||
| Turnout | 3,784 | 31.2 | -24.4 | ||
| Labour hold | Swing | ||||
Pontefract South ward
| Party | Candidate | Votes | % | ± | |
|---|---|---|---|---|---|
| Labour | Tony Dean | 2,734 | 53.5 | +17.1 | |
| Conservative | Philip Booth | 2,341 | 45.8 | +6.7 | |
| Majority | 393 | 7.7 | |||
| Turnout | 5,114 | 42.5 | -20.5 | ||
| Labour gain from Conservative | Swing | ||||
South Elmsall and South Kirkby ward
| Party | Candidate | Votes | % | ± | |
|---|---|---|---|---|---|
| Labour | Steven Tulley | 3,613 | 77.6 | +30.8 | |
| Conservative | Christian IAnson | 563 | 12.1 | +2.1 | |
| BNP | Darren Lumb | 441 | 9.5 | -4.1 | |
| Majority | 3,050 | 65.5 | +47.7 | ||
| Turnout | 4,656 | 34.7 | -19.7 | ||
| Labour gain from Independent | Swing | ||||
Stanley and Outwood East ward
| Party | Candidate | Votes | % | ± | |
|---|---|---|---|---|---|
| Labour | Clive Hudson | 2,478 | 55.3 | +17.8 | |
| Conservative | Richard Wakefield | 1,611 | 36.0 | +3.1 | |
| Liberal Democrat | Margaret Dodd | 360 | 8.0 | -11.6 | |
| Majority | 867 | 19.3 | +14.7 | ||
| Turnout | 4,481 | 37.1 | -28.1 | ||
| Labour hold | Swing | ||||
Wakefield East ward
| Party | Candidate | Votes | % | ± | |
|---|---|---|---|---|---|
| Labour | Ron Halliday | 2,497 | 63.0 | +13.5 | |
| Conservative | Anthony Bracewell | 786 | 19.8 | -0.7 | |
| Socialist Alternative | Michael Griffiths | 355 | 9.0 | +6.5 | |
| Liberal Democrat | Rob Bell | 294 | 7.4 | +7.4 | |
| Majority | 1,711 | 43.2 | +14.2 | ||
| Turnout | 3,964 | 33.6 | -19.9 | ||
| Labour hold | Swing | ||||
Wakefield North ward
| Party | Candidate | Votes | % | ± | |
|---|---|---|---|---|---|
| Labour | Margaret Isherwood | 2,096 | 57.2 | +15 | |
| Conservative | Gareth Hunt | 915 | 25 | -4.7 | |
| UKIP | Keith Wells | 379 | 10.3 | +6.6 | |
| Liberal Democrat | Dale Doug | 259 | 7.1 | -10.1 | |
| Majority | 1,181 | 32.2 | +19.7 | ||
| Turnout | 3,667 | 32.8 | -24.6 | ||
| Labour hold | Swing | ||||
Wakefield Rural ward
| Party | Candidate | Votes | % | ± | |
|---|---|---|---|---|---|
| Conservative | Ian Sanders | 2,384 | 44.0 | -0.6 | |
| Labour | John Newsome | 2,310 | 42.6 | +11.5 | |
| Green | Miriam Hawkins | 418 | 7.7 | +7.7 | |
| Liberal Democrat | Dennis Cronin | 271 | 5.0 | -11.4 | |
| Majority | 74 | 1.4 | -12.2 | ||
| Turnout | 5,421 | 40.3 | -28.7 | ||
| Conservative hold | Swing | ||||
Wakefield South ward
| Party | Candidate | Votes | % | ± | |
|---|---|---|---|---|---|
| Conservative | Monica Graham | 2,545 | 54.7 | +16.5 | |
| Labour | Nick Brown | 1,610 | 34.6 | +10.6 | |
| Liberal Democrat | Stephen Nuthall | 469 | 10.1 | -5.5 | |
| Majority | 935 | 20.1 | +5.9 | ||
| Turnout | 4,655 | 43.4 | -23.2 | ||
| Conservative hold | Swing | ||||
Wakefield West ward
| Party | Candidate | Votes | % | ± | |
|---|---|---|---|---|---|
| Conservative | Bill Sanders | 1,569 | 40.1 | +2.0 | |
| Labour | Hilary Mitchell | 1,521 | 38.9 | +3.6 | |
| Independent | Norman Tate | 448 | 11.5 | +11.5 | |
| Green | Brian Else | 208 | 5.3 | +1.5 | |
| Liberal Democrat | Susan Morgan | 140 | 3.6 | -10.7 | |
| Majority | 48 | 1.2 | -1.6 | ||
| Turnout | 3,908 | 34.5 | -21.5 | ||
| Conservative hold | Swing | ||||
Wrenthorpe and Outwood West ward
| Party | Candidate | Votes | % | ± | |
|---|---|---|---|---|---|
| Labour | Charlie Keith | 2,033 | 44.4 | +1.9 | |
| Conservative | Richard Hunt | 1,638 | 35.8 | -10.1 | |
| UKIP | David Dews | 613 | 13.4 | +13.4 | |
| Liberal Democrat | Sean McHale | 280 | 6.1 | +6.1 | |
| Majority | 395 | 8.6 | |||
| Turnout | 4,574 | 39.4 | -25.1 | ||
| Labour gain from Conservative | Swing | ||||
References
| City of Bradford Metropolitan District Council | |
|---|---|
| Calderdale Metropolitan Borough Council | |
| Kirklees Metropolitan Borough Council | |
| Leeds City Council | |
| Wakefield Metropolitan District Council | |
| West Yorkshire County Council | |
| West Riding County Council | |
| |
This article is issued from Wikipedia - version of the 7/4/2016. The text is available under the Creative Commons Attribution/Share Alike but additional terms may apply for the media files.