California's 30th congressional district
| California's 30th congressional district | ||
|---|---|---|
.tif.png) | ||
| Current Representative | Brad Sherman (D–Sherman Oaks) | |
| Ethnicity | 53.4% White, 4.2% Black, 11.9% Asian, 27.0% Hispanic, 3.5[1]% other | |
| Cook PVI | D+14 | |
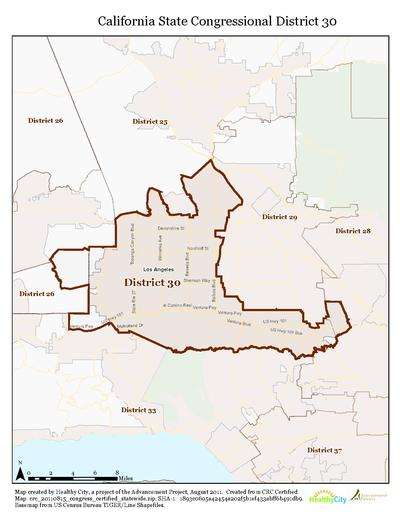
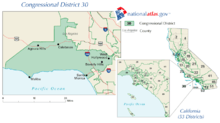
California's 30th congressional district is a congressional district in the U.S. state of California, in the western San Fernando Valley of Los Angeles County and the eastern Simi Hills of Ventura County.
The district is currently represented by Brad Sherman, who won the November 2012 Election for the seat.[2]
Communities
The 30th congressional district boundaries currently include the communities of:
- Bell Canyon
- Canoga Park, Los Angeles
- Chatsworth, Los Angeles
- Encino, Los Angeles
- Granada Hills, Los Angeles
- Hidden Hills
- Reseda, Los Angeles
- Santa Susana Field Laboratory
- Sherman Oaks, Los Angeles
- Studio City, Los Angeles
- Tarzana, Los Angeles
- Toluca Lake, Los Angeles
- West Hills, Los Angeles
- Winnetka, Los Angeles
- Woodland Hills, Los Angeles
History
Before the 2013 redistricting resulting from the 2010 United States Census and the 2012 elections, the western Los Angeles County district was represented by Democrat Henry A. Waxman. From 2003 to 2013 the district included many of the cities and suburbs of western Greater Los Angeles, most notably Hollywood, West Hollywood, Beverly Hills, Santa Monica, Pacific Palisades, Malibu and Topanga, Calabasas, Agoura Hills, Woodland Hills.
Recent election results from statewide races
| Year | U.S. President | U.S. Senator (Class 1) | U.S. Senator (Class 3) | Governor |
|---|---|---|---|---|
| 1992 | Clinton: 62.7 - 24.2% | Feinstein: 66.7 - 26.0% | Boxer: 61.2 - 30.3% | — |
| 1994 | — | (data missing) | — | (data missing) |
| 1996 | (data missing) | — | — | — |
| 1998 | — | — | (data missing) | (data missing) |
| 2000 | Gore: 75.0 - 19.3%[3] | Feinstein: 73.2 - 16.5%[4] | — | — |
| 2002 | — | — | — | Davis: 57.1 - 33.0%[5] |
| 2003 | — | — | — | Recall: No 57.3 - 42.7%[6][7] Schwarzenegger 43.5 - 38.7% |
| 2004 | Kerry: 66.1 - 32.8%[8] | — | Boxer: 69.4 - 26.8%[9] | — |
| 2006 | — | Feinstein: 71.7 - 29.6%[10] | — | Schwarzenegger: 49.8 - 45.9%[11] |
| 2008 | Obama: 70.4 - 27.9%[12] | — | — | — |
| 2010 | — | — | Boxer: 62.8 - 33.8% | Brown: 62.1 - 34.8% |
| 2012 | (data missing) | (data missing) | — | — |
| 2014 | — | — | — | (data missing) |
| 2016 | TBD | — | TBD | — |
List of representatives
| Representative | Party | Years | Notes | Counties |
|---|---|---|---|---|
| District created | January 3, 1953 | |||
.jpg) Bob Wilson Bob Wilson |
Republican | January 3, 1953 – January 3, 1963 |
Redistricted to the 36th district | San Diego |
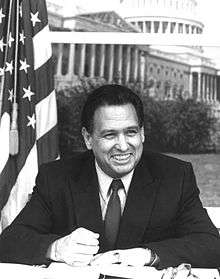
 Edward R. Roybal Edward R. Roybal |
Democratic | January 3, 1963 – January 3, 1975 |
Redistricted to the 25th district | Los Angeles |
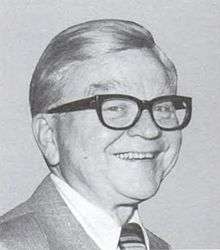 George E. Danielson George E. Danielson |
Democratic | January 3, 1975 – March 9, 1982 |
Redistricted from the 29th district Resigned after being appointed as associate justice on California Court of Appeal | |
| Vacant | March 9, 1982 – July 13, 1982 |
|||
 Matthew G. Martinez Matthew G. Martinez |
Democratic | July 13, 1982 – January 3, 1983 |
||
| January 3, 1983 – January 3, 1993 |
Redistricted to the 31st district | Los Angeles (San Gabriel Valley) | ||
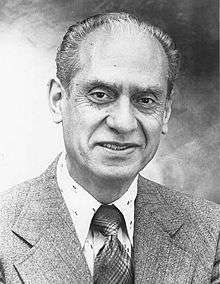
 Xavier Becerra Xavier Becerra |
Democratic | January 3, 1993 – January 3, 2003 |
Redistricted to the 31st district | Central/East/Southeast Los Angeles |
 Henry Waxman Henry Waxman |
Democratic | January 3, 2003 – January 3, 2013 |
Redistricted from the 29th district Redistricted to the 33rd district |
West Side Los Angeles |
 Brad Sherman Brad Sherman |
Democratic | January 3, 2013 – present | Redistricted from the 27th district | Western San Fernando Valley including Sherman Oaks |
Election results
|
1952 • 1954 • 1956 • 1958 • 1960 • 1962 • 1964 • 1966 • 1968 • 1970 • 1972 • 1974 • 1976 • 1978 • 1980 • 1982 (Special) • 1982 • 1984 • 1986 • 1988 • 1990 • 1992 • 1994 • 1996 • 1998 • 2000 • 2002 • 2004 • 2006 • 2008 • 2010 • 2012 • 2014 |
1952
| Party | Candidate | Votes | % | ||
|---|---|---|---|---|---|
| Republican | Bob Wilson | 121,322 | 59.6 | ||
| Democratic | De Graff Austin | 82,311 | 40.4 | ||
| Total votes | 203,633 | 100.0 | |||
| Voter turnout | % | ||||
| Republican win (new seat) | |||||
1954
| Party | Candidate | Votes | % | |
|---|---|---|---|---|
| Republican | Bob Wilson (incumbent) | 94,623 | 60.4 | |
| Democratic | Ross T. McIntire | 61,994 | 39.6 | |
| Total votes | 156,617 | 100.0 | ||
| Voter turnout | % | |||
| Republican hold | ||||
1956
| Party | Candidate | Votes | % | |
|---|---|---|---|---|
| Republican | Bob Wilson (incumbent) | 142,753 | 66.7 | |
| Democratic | George A. Cheney | 71,112 | 33.3 | |
| Total votes | 213,865 | 100.0 | ||
| Voter turnout | % | |||
| Republican hold | ||||
1958
| Party | Candidate | Votes | % | |
|---|---|---|---|---|
| Republican | Bob Wilson (incumbent) | 112,290 | 52.7 | |
| Democratic | Lionel Van Deerlin | 90,641 | 47.3 | |
| Total votes | 202,931 | 100.0 | ||
| Voter turnout | % | |||
| Republican hold | ||||
1960
| Party | Candidate | Votes | % | |
|---|---|---|---|---|
| Republican | Bob Wilson (incumbent) | 158,679 | 59.3 | |
| Democratic | Walter Wencke | 108,882 | 40.7 | |
| Total votes | 267,561 | 100.0 | ||
| Voter turnout | % | |||
| Republican hold | ||||
1962
| Party | Candidate | Votes | % | |||
|---|---|---|---|---|---|---|
| Democratic | Edward R. Roybal | 69,008 | 56.5 | |||
| Republican | Gordon L. McDonough (inc.) | 53,104 | 43.5 | |||
| Total votes | 122,112 | 100.0 | ||||
| Voter turnout | % | |||||
| Democratic gain from Republican | ||||||
1964
| Party | Candidate | Votes | % | |
|---|---|---|---|---|
| Democratic | Edward R. Roybal (incumbent) | 90,329 | 66.3 | |
| Republican | Alfred J. Feder | 45,912 | 33.7 | |
| Total votes | 136,241 | 100.0 | ||
| Voter turnout | % | |||
| Democratic hold | ||||
1966
| Party | Candidate | Votes | % | |
|---|---|---|---|---|
| Democratic | Edward R. Roybal (incumbent) | 72,173 | 66.4 | |
| Republican | Henri O'Bryant, Jr. | 36,506 | 33.6 | |
| Total votes | 108,679 | 100.0 | ||
| Voter turnout | % | |||
| Democratic hold | ||||
1968
| Party | Candidate | Votes | % | |
|---|---|---|---|---|
| Democratic | Edward R. Roybal (incumbent) | 75,381 | 67.5 | |
| Republican | Samuel F. Cavnar | 36,312 | 32.5 | |
| Total votes | 111,693 | 100.0 | ||
| Voter turnout | % | |||
| Democratic hold | ||||
1970
| Party | Candidate | Votes | % | |
|---|---|---|---|---|
| Democratic | Edward R. Roybal (incumbent) | 63,903 | 68.3 | |
| Republican | Samuel F. Cavnar | 28,038 | 29.9 | |
| American Independent | Boris Belousov | 1,681 | 1.8 | |
| Total votes | 93,622 | 100.0 | ||
| Voter turnout | % | |||
| Democratic hold | ||||
1972
| Party | Candidate | Votes | % | |
|---|---|---|---|---|
| Democratic | Edward R. Roybal (incumbent) | 76,521 | 68.4 | |
| Republican | Bill Brophy | 32,005 | 28.6 | |
| Peace and Freedom | Lewis McCammon | 3,355 | 3.0 | |
| Total votes | 111,881 | 100.0 | ||
| Voter turnout | % | |||
| Democratic hold | ||||
1974
| Party | Candidate | Votes | % | |
|---|---|---|---|---|
| Democratic | George E. Danielson (inc.) | 66,074 | 74.2 | |
| Republican | John J. Perez | 22,928 | 25.8 | |
| Total votes | 89,002 | 100.0 | ||
| Voter turnout | % | |||
| Democratic hold | ||||
1976
| Party | Candidate | Votes | % | |
|---|---|---|---|---|
| Democratic | George E. Danielson (inc.) | 82,767 | 74.4 | |
| Republican | Harry Couch | 28,503 | 25.6 | |
| Total votes | 111,270 | 100.0 | ||
| Voter turnout | % | |||
| Democratic hold | ||||
1978
| Party | Candidate | Votes | % | |
|---|---|---|---|---|
| Democratic | George E. Danielson (inc.) | 66,241 | 71.4 | |
| Republican | Henry Ares | 26,511 | 28.6 | |
| Total votes | 92,752 | 100.0 | ||
| Voter turnout | % | |||
| Democratic hold | ||||
1980
| Party | Candidate | Votes | % | |
|---|---|---|---|---|
| Democratic | George E. Danielson (inc.) | 74,119 | 72.1 | |
| Republican | J. Arthur "Art" Platten | 24,136 | 23.5 | |
| Libertarian | Bruce M. Hobbs | 4,480 | 4.4 | |
| Total votes | 102,735 | 100.0 | ||
| Voter turnout | % | |||
| Democratic hold | ||||
1982 (Special)
| Party | Candidate | Votes | % | |
|---|---|---|---|---|
| Democratic | Matthew G. Martinez | ' | 51.0 | |
| Republican | Ralph Roy Ramirez | 49.0 | ||
| Total votes | {{{votes}}} | 100.0 | ||
| Voter turnout | % | |||
| Democratic hold | ||||
1982
| Party | Candidate | Votes | % | |
|---|---|---|---|---|
| Democratic | Matthew G. Martinez (inc.) | 60,905 | 53.9 | |
| Republican | John H. Rousselot | 52,177 | 46.1 | |
| Total votes | 113,082 | 100.0 | ||
| Voter turnout | % | |||
| Democratic hold | ||||
1984
| Party | Candidate | Votes | % | |
|---|---|---|---|---|
| Democratic | Matthew G. Martinez (inc.) | 64,378 | 51.8 | |
| Republican | Richard Gomez | 53,900 | 43.4 | |
| American Independent | Houston A. Meyers | 6,055 | 4.9 | |
| Total votes | 124,333 | 100.0 | ||
| Voter turnout | % | |||
| Democratic hold | ||||
1986
| Party | Candidate | Votes | % | |
|---|---|---|---|---|
| Democratic | Matthew G. Martinez (inc.) | 59,369 | 62.5 | |
| Republican | John W. Almquist | 33,705 | 35.5 | |
| Libertarian | Kim J. Goldsworthy | 1,911 | 2.0 | |
| Total votes | 94,985 | 100.0 | ||
| Voter turnout | % | |||
| Democratic hold | ||||
1988
| Party | Candidate | Votes | % | |
|---|---|---|---|---|
| Democratic | Matthew G. Martinez (inc.) | 72,253 | 59.9 | |
| Republican | Ralph Roy Ramirez | 43,833 | 25.5 | |
| American Independent | Houston A. Myers | 2,694 | 2.2 | |
| Libertarian | Kim J. Goldsworthy | 1,864 | 1.5 | |
| Total votes | 120,644 | 100.0 | ||
| Voter turnout | % | |||
| Democratic hold | ||||
1990
| Party | Candidate | Votes | % | |
|---|---|---|---|---|
| Democratic | Matthew G. Martinez (inc.) | 45,456 | 58.2 | |
| Republican | Reuben D. Franco | 28,914 | 37.0 | |
| Libertarian | George Curtis Feger | 3,713 | 4.8 | |
| Total votes | 78,083 | 100.0 | ||
| Voter turnout | % | |||
| Democratic hold | ||||
1992
| Party | Candidate | Votes | % | |
|---|---|---|---|---|
| Democratic | Xavier Becerra | 48,800 | 58.4 | |
| Republican | Mark Robbins | 20,034 | 25.7 | |
| Green | Blase Bonpane | 6,315 | 7.6 | |
| Peace and Freedom | Elizabeth A. Nakano | 6,173 | 7.4 | |
| Libertarian | Andrew "Drew" Consalvo | 2,221 | 2.7 | |
| Total votes | 83,543 | 100.0 | ||
| Voter turnout | % | |||
| Democratic hold | ||||
1994
| Party | Candidate | Votes | % | |
|---|---|---|---|---|
| Democratic | Xavier Becerra (incumbent) | 43,943 | 66.15 | |
| Republican | David A. Ramirez | 18,741 | 28.21 | |
| Libertarian | R. William Weilberg | 3,741 | 5.63 | |
| Total votes | 66,425 | 100.0 | ||
| Voter turnout | % | |||
| Democratic hold | ||||
1996
| Party | Candidate | Votes | % | |
|---|---|---|---|---|
| Democratic | Xavier Becerra (incumbent) | 58,283 | 72.4 | |
| Republican | Patricia Parker | 15,078 | 18.7 | |
| Libertarian | Pam Probst | 2,759 | 3.4 | |
| Peace and Freedom | Shirley Mandel | 2,499 | 3.1 | |
| Natural Law | Rosemary Watson-Frith | 1,971 | 2.4 | |
| Total votes | 70,590 | 100.0 | ||
| Voter turnout | % | |||
| Democratic hold | ||||
1998
| Party | Candidate | Votes | % | |
|---|---|---|---|---|
| Democratic | Xavier Becerra (incumbent) | 58,230 | 81.25 | |
| Republican | Patricia Parker | 13,441 | 18.75 | |
| Total votes | 71,671 | 100.0 | ||
| Voter turnout | % | |||
| Democratic hold | ||||
2000
| Party | Candidate | Votes | % | |
|---|---|---|---|---|
| Democratic | Xavier Becerra (incumbent) | 83,223 | 83.3 | |
| Republican | Tony Goss | 11,788 | 11.8 | |
| Libertarian | Jason E. Heath | 2,858 | 2.9 | |
| Natural Law | Gary D. Hearne | 2,051 | 2.0 | |
| Total votes | 99,920 | 100.0 | ||
| Voter turnout | % | |||
| Democratic hold | ||||
2002
| Party | Candidate | Votes | % | |
|---|---|---|---|---|
| Democratic | Henry Waxman | 130,604 | 70.4 | |
| Republican | Tony D. Goss | 54,989 | 29.6 | |
| Total votes | 185,593 | 100.0 | ||
| Voter turnout | % | |||
| Democratic hold | ||||
2004
| Party | Candidate | Votes | % | |
|---|---|---|---|---|
| Democratic | Henry Waxman (incumbent) | 216,682 | 71.3 | |
| Republican | Victor Elizalde | 87,465 | 28.7 | |
| Total votes | 313,147 | 100.0 | ||
| Voter turnout | % | |||
| Democratic hold | ||||
2006
| Party | Candidate | Votes | % | |
|---|---|---|---|---|
| Democratic | Henry Waxman (incumbent) | 151,284 | 71.5 | |
| Republican | David Nelson Jones | 55,904 | 26.4 | |
| Peace and Freedom | Adele M. Cannon | 4,546 | 2.1 | |
| Total votes | 211,734 | 100.0 | ||
| Voter turnout | % | |||
| Democratic hold | ||||
2008
| Party | Candidate | Votes | % | |
|---|---|---|---|---|
| Democratic | Henry Waxman (incumbent) | 242,792 | 100.00 | |
| Total votes | 242,792 | 100.0 | ||
| Voter turnout | % | |||
| Democratic hold | ||||
2010
| Party | Candidate | Votes | % | |
|---|---|---|---|---|
| Democratic | Henry Waxman (incumbent) | 153,663 | 64.63 | |
| Republican | Charles E. Wilkerson | 75,948 | 31.94 | |
| Libertarian | Erich D. Miller | 5,021 | 2.11 | |
| Peace and Freedom | Richard R. Castaldo | 3,115 | 1.32 | |
| Total votes | 237,747 | 100.00 | ||
| Voter turnout | % | |||
| Democratic hold | ||||
2012
| Party | Candidate | Votes | % | |
|---|---|---|---|---|
| Democratic | Brad Sherman (incumbent) | 149,456 | 60.3 | |
| Democratic | Howard Berman (incumbent) | 98,395 | 39.7 | |
| Total votes | 247,851 | 100.0 | ||
| Democratic hold | ||||
2014
| Party | Candidate | Votes | % | |
|---|---|---|---|---|
| Democratic | Brad Sherman (incumbent) | 86,568 | 66% | |
| Republican | Mark S. Reed | 45,315 | 34% | |
| Total votes | 131,883 | 100% | ||
| Democratic hold | ||||
Living former Members
As of April 2015, there are two former members of the U.S. House of Representatives from California's 30th congressional district that are currently living.
| Representative | Term in office | Date of birth (and age) |
|---|---|---|
| Xavier Becerra | 1995 - 2003 | January 26, 1958 |
| Henry Waxman | 2003 - 2013 | September 12, 1939 |
Historical district boundaries
See also
References
- ↑ "California's citizen commission final district maps: Find out what's changed where you live". Los Angeles Times. August 2, 2011.
- ↑ Merl, Jean (7 November 2012). "Brad Sherman wins 30th Congressional District seat in Valley - latimes.com". Los Angeles Times. Retrieved 9 November 2012.
- ↑ Statement of Vote (2000 President)
- ↑ Statement of Vote (2000 Senator)
- ↑ Statement of Vote (2002 Governor)
- ↑ Statement of Vote (2003 Recall Question)
- ↑ Statement of Vote (2003 Governor)
- ↑ Statement of Vote (2004 President)
- ↑ Statement of Vote (2004 Senator)
- ↑ Statement of Vote (2006 Senator)
- ↑ Statement of Vote (2006 Governor)
- ↑ (2008 President)
- ↑ 1952 election results
- ↑ 1954 election results
- ↑ 1956 election results
- ↑ 1958 election results
- ↑ 1960 election results
- ↑ 1962 election results
- ↑ 1964 election results
- ↑ 1966 election results
- ↑ 1968 election results
- ↑ 1970 election results
- ↑ 1972 election results
- ↑ 1974 election results
- ↑ 1976 election results
- ↑ 1978 election results
- ↑ 1980 election results
- ↑ 1982 special election results
- ↑ 1982 election results
- ↑ 1984 election results
- ↑ 1986 election results
- ↑ 1988 election results
- ↑ 1990 election results
- ↑ 1992 election results
- ↑ 1994 election results
- ↑ 1996 election results
- ↑ 1998 election results
- ↑ 2000 election results
- ↑ 2002 general election results Archived February 3, 2009, at the Wayback Machine.
- ↑ 2004 general election results
- ↑ 2006 general election results Archived November 27, 2008, at the Wayback Machine.
- ↑ 2008 general election results
- ↑ 2010 general election results
- ↑ 2012 general election results Archived October 19, 2013, at the Wayback Machine.
- ↑ 2012 general election results Archived October 19, 2013, at the Wayback Machine.
External links
- GovTrack.us: Map of California's 30th congressional district
- Nationaljournal.com: The Almanac of American Politics — "California District 30"
- RAND California Election Returns: District Definitions
- GovTrack.us: Brad Sherman, U.S. Representative for California's 30th Congressional District
- California Voter Foundation map: 30th Congressional District—CD30
Coordinates: 34°12′07″N 118°32′49″W / 34.20194°N 118.54694°W