California's 38th congressional district
| California's 38th congressional district | ||
|---|---|---|
.tif.png) | ||
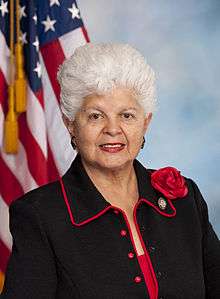
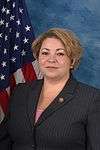
| Current Representative | Linda Sánchez (D–Lakewood) | |
| Ethnicity | 18.9% White, 3.6% Black, 14.5% Asian, 61.2% Hispanic, 1.8[1]% other | |
| Cook PVI | D+12 | |
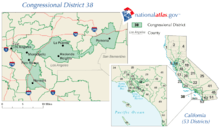
California's 38th congressional district is congressional district in the U.S. state of California based in suburban eastern Los Angeles County, California. The district is currently represented by Democrat Linda Sánchez.
Geography
The district covers several cities in southeastern Los Angeles and San Gabriel Valley areas including:
- the cities of:
- Artesia
- Bellflower
- Cerritos
- Hawaiian Gardens
- La Mirada
- La Palma
- Lakewood
- Montebello
- Norwalk
- Pico Rivera
- Santa Fe Springs
- South El Monte
- Whittier
- and the unincorporated communities of:
- Avocado Heights
- East La Mirada
- Los Nietos
- South San Gabriel,
- East Whittier, North Whittier, and South Whittier.
The major cities generally reflect an Hispanic majority, while Cerritos and La Palma have an Asian-American majority.
Recent election results from statewide races
| Year | Office | Winner and vote |
|---|---|---|
| 1992 | President | Clinton 44.6 - 33.5% |
| Senator | Herschensohn 46.3 - 45.1% | |
| Senator | Feinstein 50.9 - 39.5% | |
| 1994 | Governor | [Data unknown/missing. You can help!] |
| Senator | [Data unknown/missing. You can help!] | |
| 1996 | President | [Data unknown/missing. You can help!] |
| 1998 | Governor | [Data unknown/missing. You can help!] |
| Senator | [Data unknown/missing. You can help!] | |
| 2000 | President | Gore 57.9 - 37.3%[2] |
| Senator | Feinstein 59.6 - 33.3%[3] | |
| 2002 | Governor | Davis 62.3 - 28.7%[4] |
| 2003 | Recall | No 52.4 - 47.6%[5][6] |
| Bustamante 47.1 - 37.9% | ||
| 2004 | President | Kerry 65.3 - 33.6%[7] |
| Senator | Boxer 70.8 - 23.4%[8] | |
| 2006 | Governor | Angelides 58.3 - 37.1%[9] |
| Senator | Feinstein 71.9 - 23.0%[10] | |
| 2008 | President | Obama 72.3 - 26.6%[11] |
| 2010 | Governor | Brown 68.1 - 25.9% |
| Senator | Boxer 67.1 - 26.4% |
List of representatives
Election results
|
1962 • 1964 • 1966 • 1968 • 1970 • 1972 • 1974 • 1976 • 1978 • 1980 • 1982 • 1984 • 1986 • 1988 • 1990 • 1992 • 1994 • 1996 • 1998 • 2000 • 2002 • 2004 • 2006 • 2008 • 2010 • 2012 • 2014 |
1962
| Party | Candidate | Votes | % | |||
|---|---|---|---|---|---|---|
| Republican | Patrick M. Martin | 68,583 | 55.9 | |||
| Democratic | Dalip Singh Saund (incumbent) | 54,022 | 44.1 | |||
| Total votes | 122,605 | 100.0 | ||||
| Voter turnout | % | |||||
| Republican gain from Democratic | ||||||
1964
| Party | Candidate | Votes | % | |||
|---|---|---|---|---|---|---|
| Democratic | John V. Tunney | 85,661 | 52.8 | |||
| Republican | Patrick M. Martin (incumbent) | 76,525 | 47.2 | |||
| Total votes | 162,186 | 100.0 | ||||
| Voter turnout | % | |||||
| Democratic gain from Republican | ||||||
1966
| Party | Candidate | Votes | % | |
|---|---|---|---|---|
| Democratic | John V. Tunney (incumbent) | 83,216 | 54.5 | |
| Republican | Robert O. Hunter | 69,444 | 45.5 | |
| Total votes | 152,660 | 100.0 | ||
| Voter turnout | % | |||
| Democratic hold | ||||
1968
| Party | Candidate | Votes | % | |
|---|---|---|---|---|
| Democratic | John V. Tunney (incumbent) | 121,025 | 62.8 | |
| Republican | Robert O. Hunter | 68,196 | 35.4 | |
| American Independent | James H. Griffin | 2,415 | 1.3 | |
| Peace and Freedom | Terese A. Karmel | 1,205 | 0.6 | |
| Total votes | 192,841 | 100.0 | ||
| Voter turnout | % | |||
| Democratic hold | ||||
1970
| Party | Candidate | Votes | % | |||
|---|---|---|---|---|---|---|
| Republican | Victor Veysey | 87,479 | 49.8 | |||
| Democratic | David A. Tunno | 85,684 | 48.8 | |||
| American Independent | William E. Pasley | 2,481 | 3.4 | |||
| Total votes | 175,644 | 100.0 | ||||
| Voter turnout | % | |||||
| Republican gain from Democratic | ||||||
1972
| Party | Candidate | Votes | % | ||
|---|---|---|---|---|---|
| Democratic | George Brown, Jr. (incumbent) | 77,776 | 56.3 | ||
| Republican | Howard J. Snider | 60,379 | 43.7 | ||
| Total votes | 138,155 | 100.0 | |||
| Voter turnout | % | ||||
| Democratic win (new seat) | |||||
1974
| Party | Candidate | Votes | % | |||
|---|---|---|---|---|---|---|
| Democratic | Jerry M. Patterson | 67,299 | 54.0 | |||
| Republican | David Rehmann | 51,509 | 41.3 | |||
| American Independent | Lee R. Rayburn | 3,991 | 3.2 | |||
| Peace and Freedom | Larry B. Kallenberger | 1,851 | 1.5 | |||
| Total votes | 124,650 | 100.0 | ||||
| Voter turnout | % | |||||
| Democratic gain from Republican | ||||||
1976
| Party | Candidate | Votes | % | |
|---|---|---|---|---|
| Democratic | Jerry M. Patterson (incumbent) | 103,317 | 63.6 | |
| Republican | James "Jim" Combs | 59,092 | 36.4 | |
| Total votes | 162,409 | 100.0 | ||
| Voter turnout | % | |||
| Democratic hold | ||||
1978
| Party | Candidate | Votes | % | |
|---|---|---|---|---|
| Democratic | Jerry M. Patterson (incumbent) | 75,471 | 58.6 | |
| Republican | Dan Goedeke | 53,298 | 41.4 | |
| Total votes | 128,769 | 100.0 | ||
| Voter turnout | % | |||
| Democratic hold | ||||
1980
| Party | Candidate | Votes | % | |
|---|---|---|---|---|
| Democratic | Jerry M. Patterson (incumbent) | 91,880 | 55.5 | |
| Republican | Art Jacobson | 66,256 | 40.0 | |
| Libertarian | Charles E. "Chuck" Heiser | 7,301 | 4.4 | |
| Total votes | 165,437 | 100.0 | ||
| Voter turnout | % | |||
| Democratic hold | ||||
1982
| Party | Candidate | Votes | % | |||
|---|---|---|---|---|---|---|
| Democratic | Jerry M. Patterson (incumbent) | 73,914 | 52.4 | |||
| Republican | William F. "Bill" Dohr | 61,279 | 43.4 | |||
| Libertarian | Anita K. Barr | 5,989 | 4.2 | |||
| Total votes | 141,182 | 100.0 | ||||
| Voter turnout | % | |||||
| Republican gain from Democratic | ||||||
1984
| Party | Candidate | Votes | % | |||
|---|---|---|---|---|---|---|
| Republican | Bob Dornan | 86,545 | 53.2 | |||
| Democratic | Jerry M. Patterson (incumbent) | 73,231 | 45.0 | |||
| Peace and Freedom | Michael Schuyles Bright | 3,021 | 1.9 | |||
| Total votes | 162,797 | 100.0 | ||||
| Voter turnout | % | |||||
| Republican gain from Democratic | ||||||
1986
| Party | Candidate | Votes | % | |
|---|---|---|---|---|
| Republican | Bob Dornan (incumbent) | 66,032 | 55.3 | |
| Democratic | Richard H. Robinson | 50,625 | 42.4 | |
| Libertarian | Lee Connelly | 2,807 | 2.3 | |
| Total votes | 119,464 | 100.0 | ||
| Voter turnout | % | |||
| Republican hold | ||||
1988
| Party | Candidate | Votes | % | |
|---|---|---|---|---|
| Republican | Bob Dornan (incumbent) | 87,690 | 59.5 | |
| Democratic | Jerry Yudelson | 52,399 | 35.6 | |
| Libertarian | Bruce McKay | 3,733 | 2.5 | |
| Peace and Freedom | Frank German | 3,547 | 2.4 | |
| Total votes | 147,369 | 100.0 | ||
| Voter turnout | % | |||
| Republican hold | ||||
1990
| Party | Candidate | Votes | % | |
|---|---|---|---|---|
| Republican | Bob Dornan (incumbent) | 60,561 | 58.1 | |
| Democratic | Barbara Jackson | 43,693 | 41.9 | |
| Total votes | 104,254 | 100.0 | ||
| Voter turnout | % | |||
| Republican hold | ||||
1992
| Party | Candidate | Votes | % | |||
|---|---|---|---|---|---|---|
| Republican | Steve Horn | 92,038 | 48.6 | |||
| Democratic | Evan Anderson Braude | 82,108 | 43.4 | |||
| Peace and Freedom | Paul Burton | 8,391 | 4.4 | |||
| Libertarian | Blake Ashley | 6,756 | 3.6 | |||
| No party | Brown (write-in) | 14 | 0.0% | |||
| No party | Venable (write-in) | 14 | 0.0% | |||
| Total votes | 189,321 | 100.0 | ||||
| Voter turnout | % | |||||
| Republican gain from Democratic | ||||||
1994
| Party | Candidate | Votes | % | |
|---|---|---|---|---|
| Republican | Steve Horn (incumbent) | 85,225 | 58.47 | |
| Democratic | Peter Mathews | 53,681 | 36.83 | |
| Libertarian | Lester W. Mueller | 3,795 | 2.60 | |
| Peace and Freedom | Richard K. Green | 2,995 | 2.05 | |
| No party | Duke (write-in) | 73 | 0.05% | |
| Total votes | 145,769 | 100.0 | ||
| Voter turnout | % | |||
| Republican hold | ||||
1996
| Party | Candidate | Votes | % | |
|---|---|---|---|---|
| Republican | Steve Horn (incumbent) | 88,136 | 52.6 | |
| Democratic | Rick Zbur | 71,627 | 42.8 | |
| Green | William Yeager | 4,610 | 2.7 | |
| Libertarian | Paul Gautreau | 3,272 | 1.9 | |
| Total votes | 195,545 | 100.0 | ||
| Voter turnout | % | |||
| Republican hold | ||||
1998
| Party | Candidate | Votes | % | |
|---|---|---|---|---|
| Republican | Steve Horn (incumbent) | 88,136 | 52.93 | |
| Democratic | Peter Mathews | 71,627 | 44.31 | |
| Libertarian | David Bowers | 3,705 | 2.75 | |
| Republican | Margherita Underhill (write-in) | 17 | 0.01 | |
| Total votes | 163,485 | 100.0 | ||
| Voter turnout | % | |||
| Republican hold | ||||
2000
| Party | Candidate | Votes | % | |
|---|---|---|---|---|
| Republican | Steve Horn (incumbent) | 87,266 | 48.5 | |
| Democratic | Gerrie Shcipske | 85,498 | 47.5 | |
| Natural Law | Karen Blasdell-Wilkinson | 3,744 | 2.0 | |
| Libertarian | Jack Neglia | 3,614 | 2.0 | |
| Total votes | 180,122 | 100.0 | ||
| Voter turnout | % | |||
| Republican hold | ||||
2002
| Party | Candidate | Votes | % | |
|---|---|---|---|---|
| Democratic | Grace Napolitano (incumbent) | 62,600 | 71.2 | |
| Republican | Alex A. Burrola | 23,126 | 26.2 | |
| Libertarian | Al Cuperus | 2,301 | 2.6 | |
| Total votes | 88,027 | 100.0 | ||
| Voter turnout | % | |||
| Democratic hold | ||||
2004
| Party | Candidate | Votes | % | |
|---|---|---|---|---|
| Democratic | Grace Napolitano (incumbent) | 116,851 | 100.0 | |
| Voter turnout | % | |||
| Democratic hold | ||||
2006
| Party | Candidate | Votes | % | |
|---|---|---|---|---|
| Democratic | Grace Napolitano (incumbent) | 75,181 | 75.4 | |
| Republican | Sidney W. Street | 24,620 | 24.6 | |
| Total votes | 99,801 | 100.0 | ||
| Voter turnout | % | |||
| Democratic hold | ||||
2008
| Party | Candidate | Votes | % | |
|---|---|---|---|---|
| Democratic | Grace Napolitano (incumbent) | 130,211 | 81.73 | |
| Libertarian | Christopher M. Agrella | 29,113 | 18.27 | |
| Total votes | 159,324 | 100.00 | ||
| Voter turnout | % | |||
| Democratic hold | ||||
2010
| Party | Candidate | Votes | % | |
|---|---|---|---|---|
| Democratic | Grace Napolitano (incumbent) | 85,459 | 73.45 | |
| Republican | Robert Vaughn | 30,883 | 26.55 | |
| Total votes | 116,342 | 100.00 | ||
| Voter turnout | % | |||
| Democratic hold | ||||
2012
| Party | Candidate | Votes | % | |
|---|---|---|---|---|
| Democratic | Linda Sánchez (incumbent) | 145,280 | 67.5 | |
| Republican | Benjamin Campos | 69,807 | 32.5 | |
| Total votes | 215,087 | 100.0 | ||
| Democratic hold | ||||
2014
| Party | Candidate | Votes | % | |
|---|---|---|---|---|
| Democratic | Linda Sánchez (incumbent) | 58,192 | 59% | |
| Republican | Benjamin Campos | 40,288 | 41% | |
| Total votes | 98,480 | 100% | ||
| Democratic hold | ||||
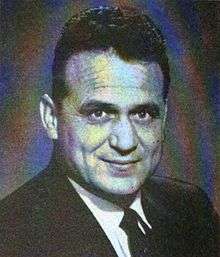
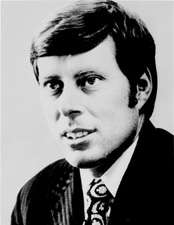
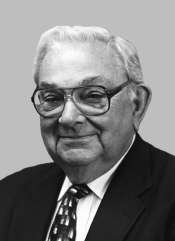
Living former Members
As of April 2015, there are four former members of the U.S. House of Representatives from California's 38th congressional district that are currently living.
| Representative | Term in office | Date of birth (and age) |
|---|---|---|
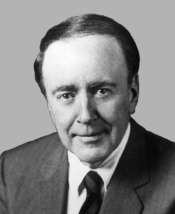
| John V. Tunney | 1965 - 1971 | June 26, 1934 |
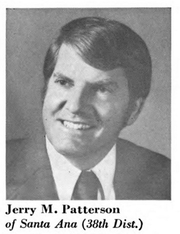
| Jerry M. Patterson | 1975 - 1985 | October 25, 1934 |
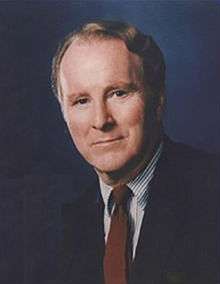
| Bob Dornan | 1985 - 1993 | April 3, 1933 |
| Grace Napolitano | 2003 - 2013 | December 4, 1936 |
Historical district boundaries
See also
References
- ↑ http://www.latimes.com/la-redistricting-map-july-2011,0,5339409.htmlstory#39.71057374407184,-118.14590136718749,5,usCongress,,,current
- ↑ Statement of Vote (2000 President)
- ↑ Statement of Vote (2000 Senator)
- ↑ Statement of Vote (2002 Governor)
- ↑ Statement of Vote (2003 Recall Question)
- ↑ Statement of Vote (2003 Governor)
- ↑ Statement of Vote (2004 President)
- ↑ Statement of Vote (2004 Senator)
- ↑ Statement of Vote (2006 Governor)
- ↑ Statement of Vote (2006 Senator)
- ↑ (2008 President)
- ↑ 1962 election results
- ↑ 1964 election results
- ↑ 1966 election results
- ↑ 1968 election results
- ↑ 1970 election results
- ↑ 1972 election results
- ↑ 1974 election results
- ↑ 1976 election results
- ↑ 1978 election results
- ↑ 1980 election results
- ↑ 1982 election results
- ↑ 1984 election results
- ↑ 1986 election results
- ↑ 1988 election results
- ↑ 1990 election results
- ↑ 1992 election results
- ↑ 1994 election results
- ↑ 1996 election results
- ↑ 1998 election results
- ↑ 2000 election results
- ↑ 2002 general election results Archived February 3, 2009, at the Wayback Machine.
- ↑ 2004 general election results
- ↑ 2006 general election results Archived November 27, 2008, at the Wayback Machine.
- ↑ 2008 general election results
- ↑ 2010 general election results
- ↑ 2012 general election results Archived October 19, 2013, at the Wayback Machine.
- ↑ 2012 general election results Archived October 19, 2013, at the Wayback Machine.
External links
- GovTrack.us: California's 38th congressional district
- RAND California Election Returns: District Definitions
- California Voter Foundation map - CD38
Coordinates: 33°56′26″N 118°03′45″W / 33.94056°N 118.06250°W