Doncaster Metropolitan Borough Council election, 2010
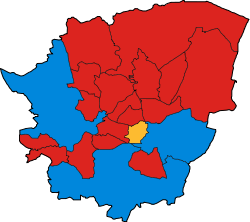
Labour
Conservative
Liberal Democrat
The 2010 Doncaster Metropolitan Borough Council election took place on 6 May 2010 to elect members of Doncaster Council in South Yorkshire, England as part of the 2010 United Kingdom local elections. One third of the council was up for election.
After the election, the composition of the council was:[1]
- Labour 34
- Liberal Democrats 10
- Conservative 9
- Others 11
Election result
| Doncaster Council Election Result 2010 | |||||
|---|---|---|---|---|---|
| Party | Seats | Seats % | Votes | Votes % | |
Labour
|17 |80.95% |45,467 |35.89% | |||||
Conservative
|3 |14.29% |25,590 |20.20% | |||||
Liberal Democrat
|1 |4.76% |19,022 |15.02% | |||||
English Democrat
|0 |0.00% |18,412 |14.53% | |||||
Independents
|0 |0.00% |9,570 |7.55% | |||||
Community Group
|0 |0.00% |2,809 |2.22% | |||||
BNP
|0 |0.00% |2,756 |2.18% | |||||
Green
|0 |0.00% |1,552 |1.23% | |||||
UKIP
|0 |0.00% |1,501 |1.18% | |||||
Ward results[2]
Adwick
| Party | Candidate | Votes | % | |
|---|---|---|---|---|
| Labour | John Mounsey | 2,948 | 51.99 | |
| Liberal Democrat | Dave Farrell | 1,068 | 18.84 | |
| English Democrat | Janine Clark | 1,004 | 17.71 | |
| Conservative | Alan Smith | 650 | 11.46 | |
| Voter turnout | 52.83% | |||
| Labour hold | ||||
Armthorpe
| Party | Candidate | Votes | % | |
|---|---|---|---|---|
| Labour | Chris McGuinness | 2,369 | 39.20 | |
| Independent | Tony Brown | 1,258 | 20.81 | |
| Liberal Democrat | Robert Mitchell | 877 | 14.51 | |
| Conservative | Malcom Andrew Knight | 848 | 14.03 | |
| English Democrat | Lawrence Edward Parramore | 692 | 11.45 | |
| Voter turnout | 55.59% | |||
| Labour gain from Independent | ||||
Askern Spa
| Party | Candidate | Votes | % | |
|---|---|---|---|---|
| Labour | Ros Jones | 2,756 | 48.58 | |
| Conservative | Martin Damian Greenhalgh | 1,502 | 26.48 | |
| English Democrat | Malcolm Eric Woodrow | 1,415 | 24.94 | |
| Voter turnout | 59.51% | |||
| Labour hold | ||||
Balby
| Party | Candidate | Votes | % | |
|---|---|---|---|---|
| Labour | Andrew Bosmans | 2,505 | 42.10 | |
| Conservative | Matthew Peter Brunning | 1,462 | 24.57 | |
| Independent | Garth Oxby | 1,289 | 21.66 | |
| Independent | Margaret Yvonne Dorothy Thompson | 694 | 11.66 | |
| Voter turnout | 53.60% | |||
| Labour gain from Independent | ||||
Bentley
| Party | Candidate | Votes | % | |
|---|---|---|---|---|
| Labour | Stuart Hardy | 2,262 | 46.96 | |
| English Democrat | Bernard Warner | 1,114 | 23.13 | |
| Independent | Eddie Storey | 792 | 16.44 | |
| Conservative | Brian Woodhouse | 649 | 13.47 | |
| Voter turnout | 49.64% | |||
| Labour hold | ||||
Bessacarr and Cantley
| Party | Candidate | Votes | % | |
|---|---|---|---|---|
| Liberal Democrat | Eric Victor Tatton-Kelly | 2,496 | 34.83 | |
| Conservative | Liz Sparrow | 1,895 | 26.44 | |
| Labour | Sue Wilkinson | 1,626 | 22.69 | |
| English Democrat | Mick Cooper | 1,149 | 16.03 | |
| Voter turnout | 64.12% | |||
| Liberal Democrat hold | ||||
Central
| Party | Candidate | Votes | % | |
|---|---|---|---|---|
| Labour | John McHale | 2,752 | 50.89 | |
| Liberal Democrat | Marie Madeleine Lane | 1,023 | 18.92 | |
| English Democrat | Berny Boldry | 783 | 14.48 | |
| Conservative | Ian Paul Hutchinson | 735 | 13.59 | |
| Community Group | Jim Davies | 115 | 2.13 | |
| Voter turnout | 49.19% | |||
| Labour hold | ||||
Conisbrough and Denaby
| Party | Candidate | Votes | % | |
|---|---|---|---|---|
| Labour | Sandra Mary Holland | 3,771 | 57.76 | |
| Liberal Democrat | John Victor Butterfield | 753 | 11.53 | |
| English Democrat | Julie Anne Bulcroft | 722 | 11.06 | |
| BNP | Erwin Toseland | 690 | 10.57 | |
| Conservative | Jonathan Sherwin Broughton | 593 | 9.08 | |
| Voter turnout | 53.66% | |||
| Labour hold | ||||
Edenthorpe, Kirk Sandall and Barnby Dun
| Party | Candidate | Votes | % | |
|---|---|---|---|---|
| Labour | David Andrew Nevett | 1,632 | 24.00 | |
| Liberal Democrat | Karl Goodman | 1,585 | 23.31 | |
| Conservative | Nick Allen | 1,383 | 20.34 | |
| English Democrat | Fred Gee | 1,100 | 16.18 | |
| Independent | Michael Thomas Maye | 1,100 | 16.18 | |
| Voter turnout | 63.00% | |||
| Labour gain from Independent | ||||
Edlington and Warmsworth
| Party | Candidate | Votes | % | |
|---|---|---|---|---|
| Labour | Elsie Butler | 2,242 | 37.49 | |
| English Democrat | Wayne Crawshaw | 1,024 | 17.12 | |
| Conservative | Liz Jones | 863 | 14.43 | |
| Liberal Democrat | Dominic Thomas Patterson | 777 | 12.99 | |
| Community Group | Margaret Ward | 722 | 12.07 | |
| Independent | Rodger Lee | 352 | 5.89 | |
| Voter turnout | 57.76% | |||
| Labour hold | ||||
Finningley
| Party | Candidate | Votes | % | |
|---|---|---|---|---|
| Conservative | Richard Allan Jones | 2,988 | 36.97 | |
| Liberal Democrat | Richard Alan Johnson | 1,995 | 24.68 | |
| English Democrat | Eric Tetley | 1,612 | 19.95 | |
| Labour | Francis Jackson | 1,487 | 18.40 | |
| Voter turnout | 67.85% | |||
| Conservative hold | ||||
Great North Road
| Party | Candidate | Votes | % | |
|---|---|---|---|---|
| Labour | Kevin Rodgers | 2,464 | 36.46 | |
| Independent | David Hughes | 1,236 | 18.29 | |
| English Democrat | Steve Grocott | 1,229 | 18.19 | |
| Conservative | Frank Lloyd Calladine | 1,222 | 18.08 | |
| Green | Stephen Platt | 607 | 8.98 | |
| Voter turnout | 58.52% | |||
| Labour gain from Independent | ||||
Hatfield
| Party | Candidate | Votes | % | |
|---|---|---|---|---|
| Labour | Linda Curran | 1,961 | 33.76 | |
| Conservative | James Vincent Hart | 1,145 | 19.71 | |
| English Democrat | Mick Glynn | 801 | 13.79 | |
| Independent | Jessie Jamieson Credland | 716 | 12.33 | |
| Liberal Democrat | Vic Fairhead | 602 | 10.36 | |
| UKIP | William Brooke Shaw | 315 | 5.42 | |
| Community Group | Stewart Anthony Rayner | 269 | 4.63 | |
| Voter turnout | 58.90% | |||
| Labour gain from Community Group | ||||
Mexborough
| Party | Candidate | Votes | % | |
|---|---|---|---|---|
| Labour | David Holland | 2,334 | 40.05 | |
| Liberal Democrat | Tracey Leyland | 1,784 | 30.61 | |
| BNP | Helen Ellis | 785 | 13.47 | |
| Conservative | Phyllis Calladine | 512 | 8.79 | |
| English Democrat | Ieva Parramore | 413 | 7.09 | |
| Voter turnout | 52.14% | |||
| Labour gain from Liberal Democrat | ||||
Rossington
| Party | Candidate | Votes | % | |
|---|---|---|---|---|
| Labour | Barry Johnson | 1,771 | 32.56 | |
| Independent | Terry Wilde | 971 | 17.85 | |
| Community Group | John Nolan Cooke | 812 | 14.93 | |
| English Democrat | Carol Young | 733 | 13.48 | |
| Liberal Democrat | Rebecca Atkinson | 638 | 11.73 | |
| Conservative | Kathleen Margaret Beard | 514 | 9.45 | |
| Voter turnout | 54.21% | |||
| Labour hold | ||||
Sprotbrough
| Party | Candidate | Votes | % | |
|---|---|---|---|---|
| Conservative | Doreen Woodhouse | 2,414 | 37.79 | |
| Labour | Peter Millar | 1,802 | 28.21 | |
| English Democrat | Barbara Hewitt | 1,342 | 21.01 | |
| Green | Lynette Chipp | 830 | 12.99 | |
| Voter turnout | 67.51% | |||
| Conservative hold | ||||
Stainforth and Moorends
| Party | Candidate | Votes | % | |
|---|---|---|---|---|
| Labour | Barbara Ann Hedley | 1,884 | 38.08 | |
| Conservative | Martin Edward Drake | 1,000 | 20.21 | |
| BNP | Dave Owen | 608 | 12.29 | |
| English Democrat | Margaret Rose Holt-Taylor | 580 | 11.72 | |
| UKIP | Ronald William Clegg | 399 | 8.06 | |
| Independent | Derek Troops | 302 | 6.10 | |
| Community Group | Mick Green | 175 | 3.54 | |
| Voter turnout | 52.05% | |||
| Labour hold | ||||
Thorne
| Party | Candidate | Votes | % | |
|---|---|---|---|---|
| Labour | Eddie Dobbs | 1,653 | 27.46 | |
| Conservative | John Brown | 1,383 | 22.98 | |
| Independent | Richard Walker | 860 | 14.29 | |
| Liberal Democrat | John Brown | 734 | 12.19 | |
| Community Group | Tony Brookes | 716 | 11.90 | |
| BNP | Anthony Holt | 673 | 11.18 | |
| Voter turnout | 57.65% | |||
| Labour gain from Community Group | ||||
Torne Valley
| Party | Candidate | Votes | % | |
|---|---|---|---|---|
| Conservative | Patricia Bartlett | 2,863 | 42.05 | |
| Liberal Democrat | David Adgar | 1,580 | 23.21 | |
| Labour | Rachel Hodson | 1,325 | 19.46 | |
| English Democrat | Bernie Aston | 523 | 7.68 | |
| UKIP | Rebecca Walters | 517 | 7.59 | |
| Voter turnout | 69.42% | |||
| Conservative hold | ||||
Town Moor
| Party | Candidate | Votes | % | |
|---|---|---|---|---|
| Labour | Jane Kidd | 1,906 | 34.17 | |
| Liberal Democrat | Kevin Michael Abell | 1,681 | 30.14 | |
| Conservative | Mark David Wells | 969 | 17.37 | |
| English Democrat | Guy Aston | 637 | 11.42 | |
| UKIP | John Michael Andrews | 270 | 4.84 | |
| Green | Darren Robinson | 115 | 2.06 | |
| Voter turnout | 55.21% | |||
| Labour gain from Liberal Democrat | ||||
Wheatley
| Party | Candidate | Votes | % | |
|---|---|---|---|---|
| Labour | Moira Hood | 2,017 | 40.46 | |
| English Democrat | Roy John Penketh | 1,539 | 30.87 | |
| Liberal Democrat | Liz Hall | 1,429 | 28.67 | |
| Voter turnout | 51.09% | |||
| Labour hold | ||||
References
| Barnsley Metropolitan Borough Council | |
|---|---|
| Doncaster Metropolitan Borough Council | |
| Rotherham Metropolitan Borough Council | |
| Sheffield City Council |
|
| South Yorkshire County Council |
|
| West Riding County Council | |
| |
This article is issued from Wikipedia - version of the 11/15/2016. The text is available under the Creative Commons Attribution/Share Alike but additional terms may apply for the media files.