Essex County Council elections
Essex County Council in England is elected every four years. Since the last boundary changes in 2005, 75 councillors are elected from 70 wards.[1]
Political control
| Party or group in control | Years |
|---|---|
| Council founded | 1889 |
| Conservative | 1973 - 1985 |
| No overall control | 1985 - 1989 |
| Conservative | 1989 - 1993 |
| No overall control | 1993 - 1997 |
| Conservative | 1997–present |
Council elections
- Essex County Council election, 1973
- Essex County Council election, 1977
- Essex County Council election, 1981
- Essex County Council election, 1985
- Essex County Council election, 1989
- Essex County Council election, 1993
- Essex County Council election, 1997
- Essex County Council election, 2001
- Essex County Council election, 2005 (boundary changes reduced the number of seats by 4)[2]
- Essex County Council election, 2009
- Essex County Council election, 2013
County result maps
-
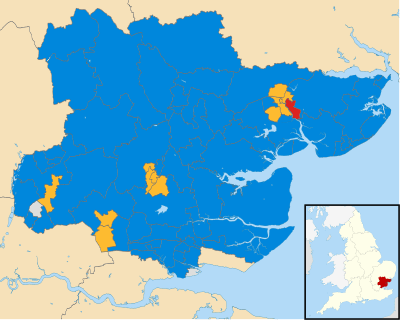
2009 results map
-
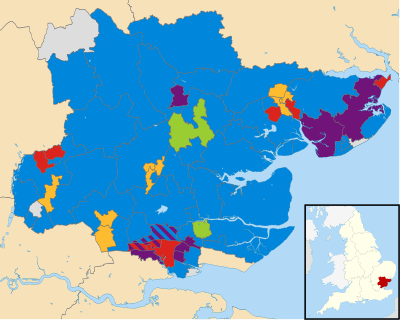
2013 results map
By-election results
1997-2001
| Party | Candidate | Votes | % | ± | |
|---|---|---|---|---|---|
| Labour | 1,717 | 37.9 | +2.2 | ||
| Conservative | 1,573 | 34.8 | -6.0 | ||
| Liberal Democrat | 1,231 | 27.2 | +3.7 | ||
| Majority | 144 | 3.1 | |||
| Turnout | 4,521 | 35.4 | |||
| Labour gain from Conservative | Swing | ||||
| Party | Candidate | Votes | % | ± | |
|---|---|---|---|---|---|
| Labour | 927 | 48.4 | +11.4 | ||
| Conservative | 527 | 27.5 | +2.0 | ||
| Independent | 404 | 21.1 | -9.8 | ||
| Liberal Democrat | 56 | 2.9 | -3.6 | ||
| Majority | 400 | 20.9 | |||
| Turnout | 1,914 | 19.4 | |||
| Labour hold | Swing | ||||
2001-2005
| Party | Candidate | Votes | % | ± | |
|---|---|---|---|---|---|
| Liberal Democrat | 1,167 | 45.0 | +24.2 | ||
| Conservative | 999 | 38.5 | -3.0 | ||
| Labour | 426 | 16.4 | -21.3 | ||
| Majority | 168 | 6.5 | |||
| Turnout | 2,592 | 19.9 | |||
| Liberal Democrat gain from Conservative | Swing | ||||
| Party | Candidate | Votes | % | ± | |
|---|---|---|---|---|---|
| Labour | Mike Danvers | 1,082 | 43.5 | -9.1 | |
| Conservative | Lee Dangerfield | 715 | 28.7 | +0.8 | |
| UKIP | Anthony Bennett | 264 | 10.5 | +10.5 | |
| Liberal Democrat | Christopher Millington | 213 | 8.6 | -10.9 | |
| Independent | Patricia Bryne | 195 | 7.8 | +7.8 | |
| English Democrat | Robin Tilbrook | 21 | 0.8 | +0.8 | |
| Majority | 367 | 14.8 | |||
| Turnout | 2,487 | 27.3 | |||
| Labour hold | Swing | ||||
2005-2009
| Party | Candidate | Votes | % | ± | |
|---|---|---|---|---|---|
| Conservative | Ann Naylor | 2,062 | 61.5 | +11.8 | |
| Liberal Democrat | Barry Aspinell | 1,150 | 34.3 | +2.3 | |
| Labour | Jane Winter | 142 | 4.2 | -4.5 | |
| Majority | 912 | 27.2 | |||
| Turnout | 3,354 | 26.0 | |||
| Conservative hold | Swing | ||||
2010-2013
| Party | Candidate | Votes | % | ± | |
|---|---|---|---|---|---|
| Labour | Tony Durcan | 5320 | 48.4 | +22.3 | |
| Conservative | Mark Gough | 4564 | 41.6 | +8.3 | |
| Liberal Democrat | John Strachan | 1100 | 10.0 | -5.4 | |
| Majority | 756 | 6.9 | |||
| Turnout | 10,984 | 37.2 | |||
| Labour gain from Conservative | Swing | ||||
Percentage changes are since June 2009. At the previous election, the Green Party had received 11.0% and the British National Party received 14.2%.
| Party | Candidate | Votes | % | ± | |
|---|---|---|---|---|---|
| Conservative | Dick Madden | 1496 | 43.6 | +10.0 | |
| Liberal Democrat | Graham Pooley | 1323 | 38.6 | -5.9 | |
| Labour | Russell Kennedy | 610 | 17.8 | +10.1 | |
| Majority | 173 | ||||
| Turnout | 3429 | 29 | |||
| Conservative gain from Liberal Democrat | Swing | ||||
Percentage changes are since June 2009, when the British National Party and the Green Party also stood, receiving 6.1% and 8.2%, respectively, of votes cast.
| Party | Candidate | Votes | % | ± | |
|---|---|---|---|---|---|
| Conservative | Ian Grundy | 1820 | 59.3 | -6.4 | |
| UKIP | Jesse Pryke | 736 | 24.1 | n/a | |
| Labour | Maurice Austin | 273 | 8.9 | +3.7 | |
| Liberal Democrat | Marian Elsden | 160 | 5.2 | -7.3 | |
| Green | Reza Hossain | 80 | 2.6 | -6.1 | |
| Majority | 1084 | ||||
| Turnout | 3069 | 22.4 | |||
| Conservative hold | Swing | ||||
Percentage changes are since June 2009. At the previous election, the British National Party received 7.8% of the votes cast
| Party | Candidate | Votes | % | ± | |
|---|---|---|---|---|---|
| Liberal Democrat | Stephen Robinson | 1614 | 42.1 | -4.6 | |
| Conservative | Robert Pontin | 941 | 24.5 | -7.5 | |
| Labour | Nastassia Player | 711 | 18.5 | +10.7 | |
| UKIP | Leslie Retford | 435 | 11.3 | n/a | |
| Green | Reza Hossain | 134 | 3.5 | -3.8 | |
| Majority | 6.9 | ||||
| Turnout | 3,835 | 28.3 | |||
| Liberal Democrat hold | Swing | ||||
Percentage changes are since June 2009. At the previous election, British National Party received 6.2%.
2013 - 2017
| Party | Candidate | Votes | % | ± | |
|---|---|---|---|---|---|
| Conservative | Alan Goggin | 1,809 | 33.7 | +9.1 | |
| UKIP | Anne Poonian | 1,642 | 30.6 | +0.2 | |
| Liberal Democrat | Gary Scott | 1,199 | 22.3 | -4.6 | |
| Labour | Carol Carlsson-Browne | 524 | 9.8 | -1.1 | |
| Green | Beverley Maltby | 200 | 3.7 | +0.2 | |
| Majority | 167 | 3.1 | |||
| Turnout | 5,374 | ||||
| Conservative gain from UKIP | Swing | ||||
| Party | Candidate | Votes | % | ± | |
|---|---|---|---|---|---|
| Conservative | Stephen Canning | 1,071 | 34.3 | +2.1 | |
| Labour | Lynn Watson | 974 | 31.2 | +1.3 | |
| UKIP | Michael Ford | 855 | 27.4 | -5.3 | |
| Green | John Malam | 165 | 5.3 | +2.2 | |
| Independent | Walter Sale | 58 | 1.9 | N/A | |
| Majority | 97 | 3.1 | |||
| Turnout | 3,123 | ||||
| Conservative gain from UKIP | Swing | ||||
| Party | Candidate | Votes | % | ± | |
|---|---|---|---|---|---|
| UKIP | Frank Ferguson | 2,034 | 42.6 | +9.2 | |
| Labour | Lynn Watson | 1,600 | 33.5 | -7.4 | |
| Conservative | Gary Maylin | 878 | 18.4 | +2.4 | |
| Green | Phillip Rackley | 264 | 5.5 | +3.1 | |
| Majority | |||||
| Turnout | |||||
| UKIP gain from Labour | Swing | ||||
| Party | Candidate | Votes | % | ± | |
|---|---|---|---|---|---|
| Holland-on-Sea Residents | Colin Sargeant | 1,781 | 46.8 | N/A | |
| UKIP | Benjamin Smith | 961 | 25.3 | +0.5 | |
| Conservative | Richard Bleach | 628 | 16.5 | -10.3 | |
| Labour | Christopher Bird | 387 | 10.2 | -0.5 | |
| Liberal Democrat | Rain Welham-Cobb | 49 | 1.3 | -0.4 | |
| Majority | |||||
| Turnout | |||||
| Holland-on-Sea Residents gain from Tendring First | Swing | ||||
References
- ↑ "Essex County Council elections 2009". Essex County Council. Retrieved 2009-08-30.
- ↑ "Local election results: Essex". BBC News Online. Retrieved 2009-08-30.
- ↑ "Results - Essex County Council & Basildon District Council By-Elections - 23rd September 2004.". Basildon District Council. Retrieved 2009-08-30.
- ↑ "By Election Results December 2004". Harloweb. Retrieved 2009-08-30.
- ↑ "Brentwood rural electoral division" (PDF). Brentwood Borough Council. Retrieved 2009-08-30.
- ↑ Essex CC result
- ↑ Essex CC result
- ↑ Essex CC result
- ↑ Essex CC result
- ↑ http://www.tendringdc.gov.uk/council/elections-voting/election-results/election-county-councillor-brightlingsea-division-9
- ↑ http://www.braintree.gov.uk/download/downloads/id/4891/declaration_of_results-bocking
External links
This article is issued from Wikipedia - version of the 9/8/2016. The text is available under the Creative Commons Attribution/Share Alike but additional terms may apply for the media files.