Grenadian general election, 2003
| | |||||||||||||||||||||||||||||||||||||||||||||||||||
| |||||||||||||||||||||||||||||||||||||||||||||||||||
| |||||||||||||||||||||||||||||||||||||||||||||||||||
| |||||||||||||||||||||||||||||||||||||||||||||||||||
 |
| This article is part of a series on the politics and government of Grenada |
|
Legislative |
|
| Administrative divisions (parishes) |
| Foreign relations |
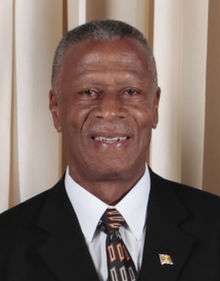
General elections were held in Grenada on 27 November 2003.[1] The New National Party government of Prime Minister Keith Mitchell won a third consecutive term with a reduced majority. Voter turnout was 57.7%.[2]
Results
| Parties | Votes | % | +/– | Seats | +/– |
|---|---|---|---|---|---|
| New National Party | 22,566 | 47.8 | -14.7 | 8 | –7 |
| National Democratic Congress | 21,445 | 45.4 | +20.3 | 7 | +7 |
| Grenada United Labour Party | 2243 | 4.7 | — | — | — |
| People's Labour Movement | 933 | 2.0 | — | — | — |
| Good Old Democratic Party | 10 | 0.0 | — | — | — |
| Grenada Renaissance Party | 6 | 0.0 | — | — | — |
| Independents | 36 | 0.1 | — | — | — |
| Invalid votes | 249 | ||||
| Total | 47,488 | 100.0 | 15 | ||
| Source: Nohlen | |||||
References
This article is issued from Wikipedia - version of the 11/26/2016. The text is available under the Creative Commons Attribution/Share Alike but additional terms may apply for the media files.
