Lincolnshire County Council election, 2005
| | |||||||||||||||||||||||||||||||||||||||||||||||||||
| |||||||||||||||||||||||||||||||||||||||||||||||||||
| |||||||||||||||||||||||||||||||||||||||||||||||||||
|
| |||||||||||||||||||||||||||||||||||||||||||||||||||
| Map of the results of the election in each division. Colours denote the winning party, as shown in the main table of results. | |||||||||||||||||||||||||||||||||||||||||||||||||||
| |||||||||||||||||||||||||||||||||||||||||||||||||||
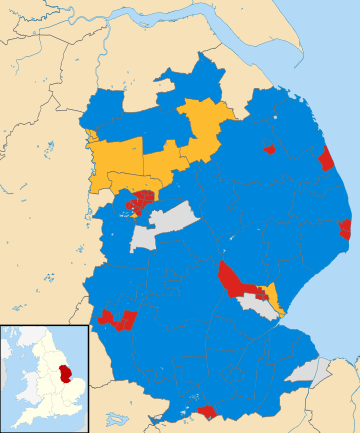
The 2005 Lincolnshire County Council election was held on Thursday, 5 May 2005, the same day as the general election. The whole council of 77 members was up for election and the election resulted in the Conservative Party retaining control of the council, winning 45 seats.[1]
Election result
| Lincolnshire County Council Elections 2005: Summary Results | ||||||||||
|---|---|---|---|---|---|---|---|---|---|---|
| Party | Seats | Gains | Losses | Net gain/loss | Seats % | Votes % | Votes | +/− | ||
| Conservative | 45 | 42.3% | 133,137 | |||||||
| Labour | 21 | 21.9% | 68,974 | |||||||
| Liberal Democrat | 8 | 20.5% | 64,344 | |||||||
| Independent | 3 | 9.6% | 30,073 | |||||||
Results by division
Alford and Sutton
| Party | Candidate | Votes | % | ± | |
|---|---|---|---|---|---|
| Conservative | Graham Marsh | 2,010 | 45.5 | -2.6 | |
| Labour | Janet Shuttleworth | 1,158 | 26.2 | -0.8 | |
| Liberal Democrat | Irene Daw | 826 | 18.7 | -6.3 | |
| Independent | Eric Vaughan | 426 | 9.6 | N.A | |
| Majority | 852 | 19.3 | |||
| Turnout | 4,420 | 61.0 | |||
| Conservative hold | Swing | ||||
Ancholme Cliff
| Party | Candidate | Votes | % | ± | |
|---|---|---|---|---|---|
| Conservative | Charles Strange | 2,032 | 54.5 | +0.7 | |
| Liberal Democrat | Andrew Heathorn | 1,138 | 30.5 | -15.8 | |
| Independent | Ernest Coleman | 556 | 14.9 | N.A | |
| Majority | 894 | 24.0 | |||
| Turnout | 3,726 | 66.0 | |||
| Conservative hold | Swing | ||||
Bardney and Cherry Willingham
| Party | Candidate | Votes | % | ± | |
|---|---|---|---|---|---|
| Conservative | Ian Fleetwood | 1,981 | 44.0 | -5.6 | |
| Liberal Democrat | Stuart Miller | 1,352 | 30.0 | +7.3 | |
| Labour | Melanie Tointon | 940 | 20.9 | -6.7 | |
| UKIP | Sue Ransome | 230 | 5.1 | N/A | |
| Majority | 629 | 14.0 | |||
| Turnout | 4,503 | 68.0 | |||
| Conservative hold | Swing | ||||
Bassingham Rural
| Party | Candidate | Votes | % | ± | |
|---|---|---|---|---|---|
| Conservative | Raymond Phillips | 2,194 | 44.2 | -6.0 | |
| Liberal Democrat | David Baker | 1,657 | 33.4 | -16.4 | |
| Labour | Tina Lee | 874 | 17.6 | N/A | |
| UKIP | Michael Starky | 241 | 4.9 | N/A | |
| Majority | 537 | 10.8 | |||
| Turnout | 4,966 | 70.0 | |||
| Conservative hold | Swing | ||||
Billinghay and Metheringham
| Party | Candidate | Votes | % | ± | |
|---|---|---|---|---|---|
| Conservative | Patricia Bradwell | 1,824 | 46.6 | -9.1 | |
| Labour | Theresa Wadsley | 1,155 | 29.5 | -14.8 | |
| Liberal Democrat | Alan Waddington | 934 | 23.9 | N/A | |
| Majority | 669 | 17.1 | |||
| Turnout | 3,913 | 62.0 | |||
| Conservative hold | Swing | ||||
Boston Coastal
| Party | Candidate | Votes | % | ± | |
|---|---|---|---|---|---|
| Conservative | Bryan Powell | 1,641 | 47.6 | -3.1 | |
| Labour | John Slater | 966 | 28.0 | -6.4 | |
| UKIP | Jodie Sutton | 844 | 24.5 | N/A | |
| Majority | 675 | 19.6 | |||
| Turnout | 3,451 | 62.0 | |||
| Conservative hold | Swing | ||||
Boston East
| Party | Candidate | Votes | % | ± | |
|---|---|---|---|---|---|
| Labour | Sandra Bakewell | 1,449 | 43.2 | -18.9 | |
| UKIP | Don Ransome | 994 | 29.6 | N/A | |
| Conservative | Sally Parker | 913 | 27.2 | -10.7 | |
| Majority | 455 | 13.6 | |||
| Turnout | 3,356 | 52.0 | |||
| Labour hold | Swing | ||||
Boston Fishtoft
| Party | Candidate | Votes | % | ± | |
|---|---|---|---|---|---|
| Liberal Democrat | Ossy Snell | 1,875 | 41.7 | +11.9 | |
| Conservative | Heather Judge | 1,422 | 31.6 | -10.1 | |
| Independent | Neil McGregor | 1,199 | 26.7 | N/A | |
| Majority | 453 | 10.1 | |||
| Turnout | 4,496 | 61.0 | |||
| Liberal Democrat gain from Conservative | Swing | ||||
Boston North West
| Party | Candidate | Votes | % | ± | |
|---|---|---|---|---|---|
| Labour | Andrew Bakewell | 1,231 | 38.8 | -16.1 | |
| Conservative | Bryan Ingham | 1,152 | 36.4 | -8.7 | |
| UKIP | Gordon Simmonds | 786 | 24.8 | N/A | |
| Majority | 79 | 2.4 | |||
| Turnout | 3,169 | 50.0 | |||
| Labour hold | Swing | ||||
Boston Rural
| Party | Candidate | Votes | % | ± | |
|---|---|---|---|---|---|
| Conservative | Alan Day | 2,782 | 58.4 | +4.6 | |
| UKIP | Steven Pearson | 1,979 | 41.6 | N/A | |
| Majority | 803 | 16.8 | |||
| Turnout | 4,761 | 57.0 | |||
| Conservative hold | Swing | ||||
Boston South
| Party | Candidate | Votes | % | ± | |
|---|---|---|---|---|---|
| Independent | Richard Austin | 1,481 | 40.4 | N/A | |
| Liberal Democrat | Bob Cory | 1,060 | 28.9 | +4.0 | |
| Conservative | Terence Taylor | 860 | 23.5 | -19.3 | |
| English Democrat | Stephen Wyatt | 264 | 7.2 | N/A | |
| Majority | 421 | 11.5 | |||
| Turnout | 3,665 | 61.0 | |||
| Independent gain from Conservative | Swing | ||||
Boston West
| Party | Candidate | Votes | % | ± | |
|---|---|---|---|---|---|
| Labour | Paul Goodale | 1,305 | 40.7 | +2.7 | |
| Conservative | Tony Austin | 1,123 | 35.0 | +1.7 | |
| UKIP | Nicholas Smith | 781 | 24.3 | N/A | |
| Majority | 182 | 5.7 | |||
| Turnout | 3,209 | 59.0 | |||
| Labour hold | Swing | ||||
Bourne Abbey
| Party | Candidate | Votes | % | ± | |
|---|---|---|---|---|---|
| Conservative | Mark Horn | 2,362 | 54.3 | +23.9 | |
| Labour | Trevor Holmes | 1,988 | 45.7 | +23.2 | |
| Majority | 374 | 8.6 | |||
| Turnout | 4,350 | 62.0 | |||
Bourne Castle
| Party | Candidate | Votes | % | ± | |
|---|---|---|---|---|---|
| Conservative | Ian Croft | 1,979 | 47.1 | -4.3 | |
| Labour | Derrick Crump | 1,131 | 26.9 | -1.3 | |
| Liberal Democrat | John Binder | 1,093 | 26.0 | +5.7 | |
| Majority | 848 | 20.2 | |||
| Turnout | 4,203 | 69.0 | |||
| Conservative hold | Swing | ||||
Bracebridge Heath and Waddington
| Party | Candidate | Votes | % | ± | |
|---|---|---|---|---|---|
| Conservative | Christine Talbot | 2,276 | 43.2 | -11.2 | |
| Labour | Jerome O'Brien | 1,811 | 34.4 | -11.2 | |
| Independent | Ivan Hall | 781 | 14.8 | N/A | |
| UKIP | Malcolm Skeels | 401 | 7.6 | N/A | |
| Majority | 465 | 8.8 | |||
| Turnout | 5,269 | 64.0 | |||
| Conservative hold | Swing | ||||
Branston and Navenby
| Party | Candidate | Votes | % | ± | |
|---|---|---|---|---|---|
| Independent | Marianne Overton | 2,771 | 54.8 | +17.7 | |
| Conservative | Derek Duncan | 1,384 | 27.4 | -8.0 | |
| Labour | Keith Haw | 902 | 17.8 | -9.6 | |
| Majority | 1,387 | 27.4 | |||
| Turnout | 5,057 | 70.0 | |||
| Independent hold | Swing | ||||
Colsterworth Rural
| Party | Candidate | Votes | % | ± | |
|---|---|---|---|---|---|
| Conservative | Edward Chapman | 1,797 | 53.5 | -9.6 | |
| Labour | Robert Shorrock | 859 | 25.6 | N/A | |
| Liberal Democrat | Ismail Jalili | 700 | 20.9 | -16.0 | |
| Majority | 938 | 27.9 | |||
| Turnout | 3,356 | 66.0 | |||
| Conservative hold | Swing | ||||
Crowland and Whaplode
| Party | Candidate | Votes | % | ± | |
|---|---|---|---|---|---|
| Conservative | Paul Przyszlak | 2,698 | 65.5 | +2.6 | |
| Liberal Democrat | Kathleen Tanner | 1,421 | 34.5 | +20.2 | |
| Majority | 1,277 | 31.0 | |||
| Turnout | 4,119 | 66.0 | |||
| Conservative hold | Swing | ||||
Deeping St James
| Party | Candidate | Votes | % | ± | |
|---|---|---|---|---|---|
| Labour | Philip Dilks | 1,752 | 51.8 | -6.7 | |
| Conservative | Bryan Helyar | 1,632 | 48.2 | +6.7 | |
| Majority | 120 | 3.6 | |||
| Turnout | 3,384 | 65.0 | |||
| Labour hold | Swing | ||||
Donington Rural
| Party | Candidate | Votes | % | ± | |
|---|---|---|---|---|---|
| Conservative | Amanda Puttick | 2,576 | 62.9 | +17.7 | |
| Liberal Democrat | Samantha Turner | 1,517 | 37.1 | N/A | |
| Majority | 1,059 | 25.8 | |||
| Turnout | 4,093 | 67.0 | |||
Folkingham Rural
| Party | Candidate | Votes | % | ± | |
|---|---|---|---|---|---|
| Conservative | Martin Hill | 3,013 | 61.7 | +5.2 | |
| Liberal Democrat | Christine Brough | 1,871 | 38.3 | +22.8 | |
| Majority | 1,142 | 23.4 | |||
| Turnout | 4,884 | 68.0 | |||
| Conservative hold | Swing | ||||
Gainsborough Hill
| Party | Candidate | Votes | % | ± | |
|---|---|---|---|---|---|
| Liberal Democrat | Michael Tinker | 1,255 | 43.6 | -35.2 | |
| Labour | Lynne Gray | 1,016 | 35.3 | N/A | |
| Conservative | Jeffrey Summers | 609 | 21.1 | -9.9 | |
| Majority | 239 | 8.3 | |||
| Turnout | 2,880 | 49.0 | |||
| Liberal Democrat hold | Swing | ||||
Gainsborough Rural South
| Party | Candidate | Votes | % | ± | |
|---|---|---|---|---|---|
| Liberal Democrat | Peter Heath | 2,945 | 54.5 | +20.1 | |
| Conservative | Brian Knight | 2,463 | 45.5 | -0.7 | |
| Majority | 482 | 9.0 | |||
| Turnout | 5,408 | 67.0 | |||
| Liberal Democrat gain from Conservative | Swing | ||||
Gainsborough Trent
| Party | Candidate | Votes | % | ± | |
|---|---|---|---|---|---|
| Liberal Democrat | Patrick O'Connor | 1,868 | 50.3 | +12.7 | |
| Labour | Patrick Vaughan | 923 | 24.8 | -12.1 | |
| Conservative | William Parry | 726 | 19.5 | -5.9 | |
| UKIP | Mark Jones | 199 | 5.4 | N/A | |
| Majority | 945 | 25.5 | |||
| Turnout | 3,716 | 51.0 | |||
| Liberal Democrat hold | Swing | ||||
Grantham Barrowby
| Party | Candidate | Votes | % | ± | |
|---|---|---|---|---|---|
| Labour | Alan Davidson | 1,646 | 52.6 | -4.5 | |
| Conservative | Pamela Bosworth | 1,486 | 47.4 | +4.5 | |
| Majority | 160 | 5.2 | |||
| Turnout | 3,132 | 53.0 | |||
| Labour hold | Swing | ||||
| Lincolnshire County Council | |||||||||||||||||||||||||||||||||||||||
|---|---|---|---|---|---|---|---|---|---|---|---|---|---|---|---|---|---|---|---|---|---|---|---|---|---|---|---|---|---|---|---|---|---|---|---|---|---|---|---|
| Boston Borough Council | |||||||||||||||||||||||||||||||||||||||
| East Lindsey District Council |
| ||||||||||||||||||||||||||||||||||||||
| City of Lincoln Council | |||||||||||||||||||||||||||||||||||||||
| North East Lincolnshire Council | |||||||||||||||||||||||||||||||||||||||
| North Kesteven District Council |
| ||||||||||||||||||||||||||||||||||||||
| North Lincolnshire Council | |||||||||||||||||||||||||||||||||||||||
| South Holland District Council |
| ||||||||||||||||||||||||||||||||||||||
| South Kesteven District Council | |||||||||||||||||||||||||||||||||||||||
| West Lindsey District Council | |||||||||||||||||||||||||||||||||||||||
| |||||||||||||||||||||||||||||||||||||||
| |||||||||||||||||||||||||||||||||||||||
| County council elections |
|
|---|---|
| Unitary authorities |
|
| District councils (Northern Ireland) | |
| Sui generis |
|
| Mayoral elections |
|
| |
References
- ↑ "Lincolnshire County Council Election Results 1973-2009" (PDF). Elections Centre. Retrieved 28 September 2016.
This article is issued from Wikipedia - version of the 10/8/2016. The text is available under the Creative Commons Attribution/Share Alike but additional terms may apply for the media files.