List of Mexican states by GDP
The following is the list of the GDP (Nominal) of Mexico's 31 federal states (and its Federal District, officially not a state), ranked in order of their GDP (Nominal) as of 2011.
Mexican states
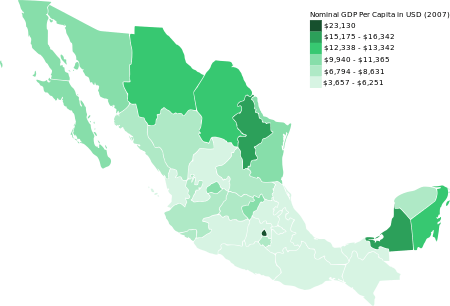
GDP per capita of Mexican states, US$, 2007.
| Mexican States by GDP - 2014[1] | |||||
|---|---|---|---|---|---|
| Rank | State | GDP (millions of MXN) | GDP (millions of USD) | Percent | |
| - | |
13,401,295 | 1,008,206 | 100% | |
| 1 | |
2,254,840 | 169,636 | 17% | |
| 2 | |
1,209,424 | 90,987 | 9% | |
| 3 | |
999,407 | 75,187 | 7% | |
| 4 | |
850,237 | 63,965 | 6% | |
| 5 | |
610,623 | 45,938 | 5% | |
| 6 | |
675,465 | 50,817 | 5% | |
| 7 | |
434,948 | 32,722 | 3% | |
| 8 | |
557,382 | 41,933 | 4% | |
| 9 | |
424,856 | 31,963 | 3% | |
| 10 | |
454,047 | 34,159 | 3% | |
| 11 | |
413,971 | 31,144 | 3% | |
| 12 | |
382,604 | 28,784 | 3% | |
| 13 | |
397,033 | 29,870 | 3% | |
| 14 | |
382,383 | 28,767 | 3% | |
| 15 | |
318,308 | 23,947 | 2% | |
| 16 | |
276,520 | 20,803 | 2% | |
| 17 | |
234,618 | 17,651 | 2% | |
| 18 | |
292,723 | 22,022 | 2% | |
| 19 | |
257,972 | 19,408 | 2% | |
| 20 | |
216,423 | 16,282 | 2% | |
| 21 | |
208,967 | 15,721 | 2% | |
| 22 | |
196,501 | 14,783 | 1% | |
| 23 | |
213,670 | 16,075 | 2% | |
| 24 | |
195,471 | 14,706 | 1% | |
| 25 | |
158,956 | 11,959 | 1% | |
| 26 | |
155,936 | 11,731 | 1% | |
| 27 | |
163,567 | 12,305 | 1% | |
| 28 | |
126,156 | 9,491 | 1% | |
| 29 | |
87,956 | 6,617 | 1% | |
| 30 | |
79,809 | 6,004 | 1% | |
| 31 | |
97,833 | 7,360 | 1% | |
| 32 | |
72,689 | 5,469 | 1% | |
See also
General:
References
- ↑ INEGI,
| Ranked | |
|---|---|
| Social | |
| Political | |
| Economy | |
| Other | |
This article is issued from Wikipedia - version of the 10/13/2016. The text is available under the Creative Commons Attribution/Share Alike but additional terms may apply for the media files.