South Hams District Council election, 2015
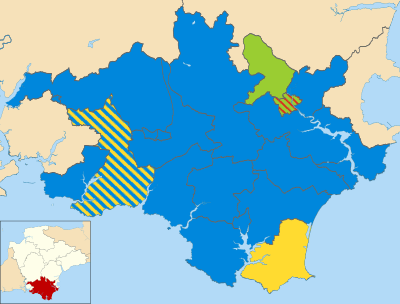
Elections to South Hams District Council took place on 7 May, the same day as other United Kingdom local elections and the General Election. 19 of the 20 wards were up for election, each with either 1,2 or 3 councillors to be elected. The number of seats up for election in each ward is indicated by the number in the brackets following the ward name. This was the first election with new boundary changes taking effect after the number of wards was reduced by ten and councillors by 19. The ward of Salcombe & Thurlestone was uncontested, with Conservative Party candidates Judy Pearce and Simon Wright elected. The Conservative Party increased their share of seats in the council, despite a slight decrease in votes. Meanwhile, the Green Party overtook the Liberal Democrats to become the largest opposition party.
| South Hams District Council election, 2015 | ||||||||||
|---|---|---|---|---|---|---|---|---|---|---|
| Party | Seats | Gains | Losses | Net gain/loss | Seats % | Votes % | Votes | +/− | ||
| Conservative | 25 | 0 | 0 | -5 | 80.6% | 53.2% | 37,500 | -2.8 | ||
| Green | 3 | 0 | 0 | 0 | 9.7% | 19.3% | 13,634 | +8.7 | ||
| Liberal Democrat | 2 | 0 | 0 | -3 | 6.5% | 10.0% | 7,044 | -10.5 | ||
| Labour | 1 | 0 | 0 | 0 | 3.2% | 12.4% | 8,755 | +8.3 | ||
| Independent | 0 | 0 | 0 | -1 | 0.0% | 2.8% | 1,952 | -4.7 | ||
| UKIP | 0 | 0 | 0 | 0 | 0.0% | 1.9% | 1312 | +0.6 | ||
| TUSC | 0 | 0 | 0 | 0 | 0.0% | 0.5% | 349 | +0.5 | ||
Ward elections
Allington & Strete
| Party | Candidate | Votes | % | ± | |
|---|---|---|---|---|---|
| Conservative | Richard John Foss | 1,280 | 71.2% | ||
| Green | Suzanne Ellis | 519 | 28.8% | ||
| Rejected ballots | 32 | 1.7% | |||
| Turnout | 1831 | 75.4% | |||
| Conservative win (new seat) | |||||
Bickleigh & Cornwood
| Party | Candidate | Votes | % | ± | |
|---|---|---|---|---|---|
| Conservative | Robert Steer | 1106 | 68.1% | ||
| Green | Paul Sampson | 328 | 20.2% | ||
| Liberal Democrat | Mary Talbot-Rosevear | 190 | 11.7% | ||
| Rejected ballots | 20 | 1.2% | |||
| Turnout | 1644 | 71.4% | |||
| Conservative win (new seat) | |||||
Blackawton & Stoke Fleming Ward
| Party | Candidate | Votes | % | ± | |
|---|---|---|---|---|---|
| Conservative | Michael Hicks | 910 | 63.6% | ||
| Green | Patrick Hadow | 521 | 36.4% | ||
| Rejected ballots | 20 | 1.4% | |||
| Turnout | 1452 | 75.9% | |||
| Conservative win (new seat) | |||||
Charterlands
| Party | Candidate | Votes | % | ± | |
|---|---|---|---|---|---|
| Conservative | Lindsay Ward | 1092 | 64.4% | ||
| Green | Jan Chapman | 330 | 19.5% | ||
| Independent | William Rosevear | 274 | 16.2% | ||
| Rejected ballots | 19 | 1.1% | |||
| Turnout | 1715 | 73.4% | |||
| Conservative win (new seat) | |||||
Dartington & Staverton
| Party | Candidate | Votes | % | ± | |
|---|---|---|---|---|---|
| Green | Jacqi Hodgson | 912 | 55.8% | ||
| Conservative | Dave Roddy | 500 | 30.6% | ||
| Labour | Joanne Tisdall | 221 | 13.5% | ||
| Rejected ballots | 16 | 1.0% | |||
| Turnout | 1649 | 76.8% | |||
| Green win (new seat) | |||||
Dartmouth & East Dart (3)
| Party | Candidate | Votes | % | ± | |
|---|---|---|---|---|---|
| Conservative | Jonathan Hawkins | 2,204 | 50.3% | ||
| Conservative | Hilary Bastone | 2,108 | 48.1% | ||
| Conservative | Rose Rowe | 1,791 | 40.9% | ||
| Labour | Benjamin Cooper | 1,028 | 23.5% | ||
| Independent | Paul Allen | 889 | 20.3% | ||
| Labour | Colin Chapman | 799 | 18.2% | ||
| Labour | David Jones | 671 | 15.3% | ||
| Rejected ballots | 107 | 2.4% | |||
| Turnout | 4,489 | 67.7% | |||
| Conservative win (new seat) | |||||
| Conservative win (new seat) | |||||
| Conservative win (new seat) | |||||
Ermington & Ugborough
| Party | Candidate | Votes | % | ± | |
|---|---|---|---|---|---|
| Conservative | Tom Holway | 998 | 60.3% | ||
| Green | Julie Deacon | 384 | 23.2% | ||
| Liberal Democrat | Samuel Blake | 274 | 16.5% | ||
| Rejected ballots | 21 | 1.3% | |||
| Turnout | 1,677 | 72.4% | |||
| Conservative win (new seat) | |||||
Ivybridge East (2)
| Party | Candidate | Votes | % | ± | |
|---|---|---|---|---|---|
| Conservative | Kathy Cuthbert | 1,337 | 45.0% | ||
| Conservative | Ann Pringle | 1,247 | 42.0% | ||
| Liberal Democrat | Tony Barber | 991 | 33.4% | ||
| Green | Kate Smallwood | 686 | 23.1% | ||
| UKIP | Eric Robbins | 619 | 20.8% | ||
| Rejected ballots | 24 | 0.8% | |||
| Turnout | 2,994 | 66.8% | |||
| Conservative win (new seat) | |||||
| Conservative win (new seat) | |||||
Ivybridge West (2)
| Party | Candidate | Votes | % | ± | |
|---|---|---|---|---|---|
| Conservative | David May | 1,827 | 57.9% | ||
| Conservative | Michael Saltern | 1,583 | 50.2% | ||
| Green | Katie Reville | 1,296 | 41.1% | ||
| Rejected ballots | 42 | 1.3% | |||
| Turnout | 3,197 | 65.6% | |||
| Conservative win (new seat) | |||||
| Conservative win (new seat) | |||||
Kingsbridge
| Party | Candidate | Votes | % | ± | |
|---|---|---|---|---|---|
| Conservative | Keith Wingate | 1,514 | 50.2% | ||
| Conservative | Rufus Gilbert | 1,513 | 50.1% | ||
| Green | Joss Webber | 768 | 25.5% | ||
| Liberal Democrat | Laurel Lawford | 711 | 23.6% | ||
| Rejected ballots | 31 | 1.0% | |||
| Turnout | 3,048 | 64.1% | |||
| Conservative win (new seat) | |||||
| Conservative win (new seat) | |||||
Loddiswell & Aveton Gifford
| Party | Candidate | Votes | % | ± | |
|---|---|---|---|---|---|
| Conservative | Ian Bramble | 1,072 | 66.9% | ||
| Green | Christopher Noakes | 531 | 33.1% | ||
| Rejected ballots | 23 | 1.4% | |||
| Turnout | 1,626 | 76.3% | |||
| Conservative win (new seat) | |||||
Marldon & Littlehempston
| Party | Candidate | Votes | % | ± | |
|---|---|---|---|---|---|
| Conservative | Trevor Pennington | 1,098 | 64.3% | ||
| Green | Christine Adams | 359 | 21.0% | ||
| Liberal Democrat | David Robinson | 251 | 14.7% | ||
| Rejected ballots | 24 | 1.4% | |||
| Turnout | 1,732 | 72.9% | |||
| Conservative win (new seat) | |||||
Newton & Yealmpton
| Party | Candidate | Votes | % | ± | |
|---|---|---|---|---|---|
| Liberal Democrat | Keith Baldry | 1,762 | 47.8% | ||
| Conservative | Ian Blackler | 1,537 | 41.7% | ||
| Conservative | Suzie Cooper | 1,417 | 38.4% | ||
| Green | John Green | 1,083 | 29.4% | ||
| Rejected ballots | 27 | 0.7% | |||
| Turnout | 3,715 | 74.9% | |||
| Liberal Democrat win (new seat) | |||||
| Conservative win (new seat) | |||||
South Brent
| Party | Candidate | Votes | % | ± | |
|---|---|---|---|---|---|
| Conservative | Robert Steer | 1,644 | 51.4% | ||
| Conservative | Peter Smerdon | 1,584 | 49.5% | ||
| Green | Tony Kuhl | 1,159 | 36.2% | ||
| Labour | Kim Gray | 627 | 19.6% | ||
| Labour | Rosie Adams | 599 | 18.7% | ||
| Rejected ballots | 30 | 0.9% | |||
| Turnout | 3228 | 75.7% | |||
| Conservative win (new seat) | |||||
| Conservative win (new seat) | |||||
Stokenham
| Party | Candidate | Votes | % | ± | |
|---|---|---|---|---|---|
| Liberal Democrat | Julian Brazil | 909 | 53.5% | ||
| Conservative | Josh Gardner | 643 | 37.9% | ||
| Green | Tom Hoeksma | 146 | 8.6% | ||
| Rejected ballots | 13 | 0.8% | |||
| Turnout | 1,711 | 76.0% | |||
| Liberal Democrat win (new seat) | |||||
Totnes (3)
| Party | Candidate | Votes | % | ± | |
|---|---|---|---|---|---|
| Green | Robert Vint | 2,215 | 45.6% | ||
| Green | Barrie Wood | 1,839 | 37.9% | ||
| Labour | David Horsburgh | 1,265 | 26.1% | ||
| Liberal Democrat | John Birch | 1,150 | 23.7% | ||
| Labour | Eleanor Cohen | 1,137 | 23.4% | ||
| Labour | Tony Whitty | 1,111 | 22.9% | ||
| Conservative | Ralph Clark | 928 | 19.1% | ||
| Conservative | Angela Shropshall-Clark | 815 | 16.8% | ||
| Conservative | Michael Footitt | 754 | 15.5% | ||
| UKIP | Anal Langmaid | 693 | 14.3% | ||
| TUSC | Alex Moore | 349 | 7.2% | ||
| Rejected ballots | 53 | 1.1% | |||
| Turnout | 4,906 | 70.8% | |||
| Green win (new seat) | |||||
| Green win (new seat) | |||||
| Labour win (new seat) | |||||
Wembury and Brixton (2)
| Party | Candidate | Votes | % | ± | |
|---|---|---|---|---|---|
| Conservative | Daniel Brown | 1,530 | 55.7% | -13.0 | |
| Conservative | Basil Fernley Cane | 1,380 | 50.2% | -13.3 | |
| Liberal Democrat | Richard Robinson | 571 | 20.8% | +20.8 | |
| Green | Katy Ward-Edwards | 558 | 20.3% | +20.3 | |
| Labour | Anna Malone | 526 | 19.1% | +19.1 | |
| Rejected ballots | 25 | 0.9% | |||
| Turnout | 2,774 | 73.8% | +23.0 | ||
| Conservative hold | Swing | ||||
| Conservative hold | Swing | ||||
West Dart
| Party | Candidate | Votes | % | ± | |
|---|---|---|---|---|---|
| Conservative | John Tucker | 831 | 52.4% | ||
| Green | Ian Donaldson | 520 | 32.8% | ||
| Liberal Democrat | Richard Heseltine | 235 | 14.8% | ||
| Rejected ballots | 18 | 1.1% | -4.5 | ||
| Turnout | 1,604 | 74.6% | |||
| Conservative win (new seat) | |||||
Woolwell
| Party | Candidate | Votes | % | ± | |
|---|---|---|---|---|---|
| Conservative | Nicky Hopwood | 1,068 | 69.8% | ||
| Green | Christopher Lindsay | 460 | 30.1% | ||
| Rejected ballots | 33 | 2.1% | |||
| Turnout | 1,562 | 65.0% | |||
| Conservative win (new seat) | |||||
References
- "Notice of Uncontested Election". South Hams District Council. Retrieved 27 October 2015.
- "Declaration of Result of Poll". South Hams District Council. 7 May 2015. Retrieved 27 October 2015.
| Devon County Council | |
|---|---|
| East Devon District Council |
|
| Exeter City Council | |
| Mid Devon District Council |
|
| North Devon District Council | |
| Plymouth City Council | |
| South Hams District Council | |
| Teignbridge District Council |
|
| Torbay Council | |
| Torridge District Council | |
| West Devon Borough Council | |
| |