Sunderland City Council elections
One third of Sunderland City Council in Tyne and Wear, England is elected each year, followed by one year without election. Since the last boundary changes in 2004, 75 councillors have been elected from 25 wards.[1]
Political control
Since the first election to the council in 1973 political control of the council has been held by the following parties:[2]
| Party in control | Years |
|---|---|
| Labour | 1973–present |
Council elections
- Sunderland City Council election, 1998
- Sunderland City Council election, 1999
- Sunderland City Council election, 2000
- Sunderland City Council election, 2002
- Sunderland City Council election, 2003
- Sunderland City Council election, 2004 (whole council elected after boundary changes)[3]
- Sunderland City Council election, 2006
- Sunderland City Council election, 2007
- Sunderland City Council election, 2008
- Sunderland City Council election, 2010
- Sunderland City Council election, 2011
- Sunderland City Council election, 2012
- Sunderland City Council election, 2014
- Sunderland City Council election, 2015
Borough result maps
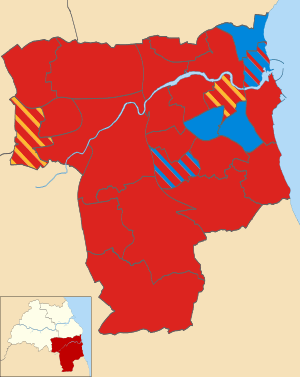 2004 results map
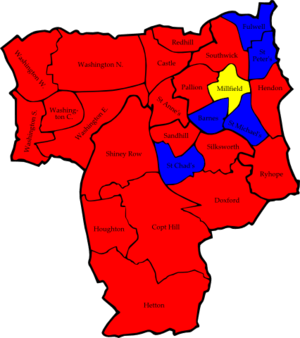 2006 results map
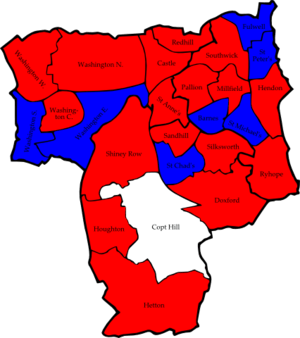 2007 results map
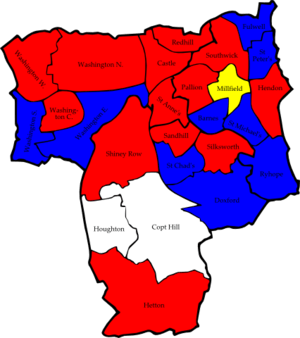 2008 results map
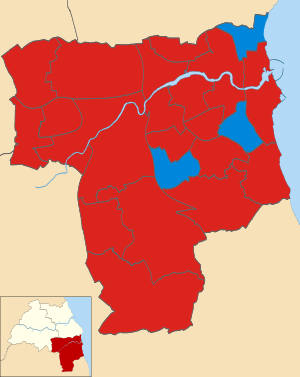 2010 results map
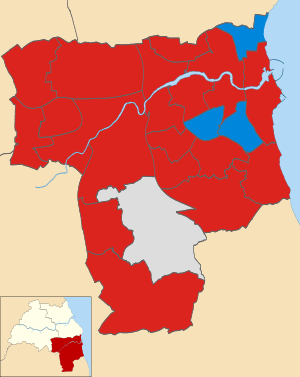 2011 results map
By-election results
1997-2001
| Party | Candidate | Votes | % | ± | |
|---|---|---|---|---|---|
| Labour | 636 | 71.1 | -10.3 | ||
| Conservative | 178 | 19.9 | +1.3 | ||
| Liberal Democrat | 80 | 9.0 | +9.0 | ||
| Majority | 458 | 51.2 | |||
| Turnout | 894 | 11.4 | |||
| Labour hold | Swing | ||||
| Party | Candidate | Votes | % | ± | |
|---|---|---|---|---|---|
| Labour | 646 | 46.7 | -18.7 | ||
| Conservative | 394 | 28.5 | +9.9 | ||
| Liberal Democrat | 343 | 24.8 | +8.9 | ||
| Majority | 252 | 18.2 | |||
| Turnout | 1,383 | 18.0 | |||
| Labour hold | Swing | ||||
| Party | Candidate | Votes | % | ± | |
|---|---|---|---|---|---|
| Labour | 509 | 63.4 | |||
| Conservative | 155 | 19.3 | |||
| Liberal Democrat | 139 | 17.3 | |||
| Majority | 354 | 44.1 | |||
| Turnout | 803 | 11.8 | |||
| Labour hold | Swing | ||||
2001-2005
| Party | Candidate | Votes | % | ± | |
|---|---|---|---|---|---|
| Labour | 3,074 | 65.9 | +2.2 | ||
| Conservative | 860 | 18.4 | -17.8 | ||
| Liberal Democrat | 731 | 15.7 | +15.7 | ||
| Majority | 2,214 | 47.5 | |||
| Turnout | 4,665 | ||||
| Labour hold | Swing | ||||
2005-2009
| Party | Candidate | Votes | % | ± | |
|---|---|---|---|---|---|
| Conservative | Anthony Morrissey | 1,139 | 50.8 | +15.8 | |
| Liberal Democrat | Peter Taylor | 547 | 24.4 | -4.7 | |
| Labour | Ian Galbraith | 489 | 21.8 | -4.5 | |
| BNP | Ian Leadbitter | 67 | 3.0 | -6.6 | |
| Majority | 592 | 26.4 | |||
| Turnout | 2,242 | 25.5 | |||
| Conservative hold | Swing | ||||
| Party | Candidate | Votes | % | ± | |
|---|---|---|---|---|---|
| Liberal Democrat | Paul Dixon | 566 | 43.5 | +10.2 | |
| Labour | Shirley Waldron | 397 | 30.5 | -1.1 | |
| Conservative | Leslie Dobson | 260 | 20.0 | -1.6 | |
| BNP | James Davison | 79 | 6.0 | -7.4 | |
| Majority | 169 | 13.0 | |||
| Turnout | 1,302 | 18.2 | |||
| Liberal Democrat hold | Swing | ||||
| Party | Candidate | Votes | % | ± | |
|---|---|---|---|---|---|
| Conservative | Angela Cuthbert | 1,196 | 49.9 | +9.8 | |
| Labour | Dianne Snowdon | 994 | 41.5 | +2.2 | |
| Liberal Democrat | David Snowball | 206 | 8.6 | -5.6 | |
| Majority | 202 | 8.4 | |||
| Turnout | 2,396 | 27.6 | |||
| Conservative gain from Labour | Swing | ||||
References
- ↑ "Information available about your Local Area". Sunderland City Council. Retrieved 2010-12-21.
- ↑ "Sunderland". BBC News Online. 19 April 2009. Retrieved 2010-12-21.
- ↑ "Sunderland council". BBC News Online. Retrieved 2010-12-21.
- ↑ "Lib-Dems retain second seat in city". Sunderland Echo. 2006-03-24. Retrieved 2010-12-21.
- ↑ "Declaration of Result of Poll". Sunderland City Council. Retrieved 2010-12-21.
External links
| Gateshead Metropolitan Borough Council | |
|---|---|
| Newcastle City Council | |
| North Tyneside Metropolitan Borough Council | |
| South Tyneside Metropolitan Borough Council | |
| Sunderland City Council | |
| Tyne and Wear County Council |
|
| |
This article is issued from Wikipedia - version of the 12/5/2015. The text is available under the Creative Commons Attribution/Share Alike but additional terms may apply for the media files.