United States presidential election in Oklahoma, 2016
| | |||||||||||||||||||||||||||||||||||||||
| |||||||||||||||||||||||||||||||||||||||
| |||||||||||||||||||||||||||||||||||||||
|
| |||||||||||||||||||||||||||||||||||||||
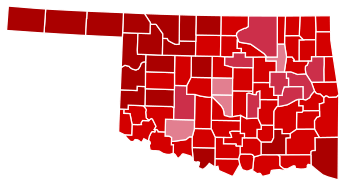
| County Results
Trump—50-60%
Trump—60-70%
Trump—70-80%
Trump—80-90% | |||||||||||||||||||||||||||||||||||||||
| |||||||||||||||||||||||||||||||||||||||
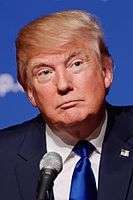
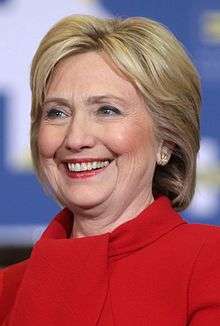

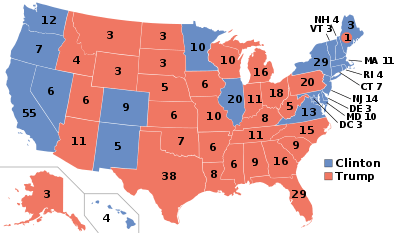
The 2016 United States presidential election in Oklahoma was held on November 8, 2016, as part of the 2016 General Election in which all 50 states plus The District of Columbia participated. Oklahoma voters chose electors to represent them in the Electoral College via a popular vote pitting the Republican Party's nominee, businessman Donald Trump, and running mate Indiana Governor Mike Pence against Democratic Party nominee, former Secretary of State Hillary Clinton and her running mate, Virginia Senator Tim Kaine.
On March 1, 2016, in the presidential primaries, Oklahoma voters expressed their preferences for the Democratic and Republican parties' respective nominees for President. Registered members of each party could only vote in their party's primary, while independent voters could only vote in the Democratic primary.[1]
Donald Trump won the election in Oklahoma with 65.3% of the vote. Hillary Clinton received 28.9% of the vote.[2] Considered a safe Republican state, Oklahoma has voted Republican in fifteen of the last sixteen elections. It was also one of two states where Donald Trump won every county, the other being West Virginia. This also marked the fourth consecutive election in which the Republican candidate carried every county in the state.
General Election
Statewide Results
| United States presidential election in Oklahoma, 2016[3] | |||||
|---|---|---|---|---|---|
| Party | Candidate | Votes | Percentage | Electoral votes | |
| Republican | Donald Trump | 947,934 | 65.33% | 7 | |
| Democratic | Hillary Clinton | 419,788 | 28.93% | 0 | |
| Libertarian | Gary Johnson | 83,334 | 5.74% | 0 | |
| Totals | 1,451,056 | 100.0% | 7 | ||
Results by County
| County | Trump# | Trump% | Clinton# | Clinton% | Johnson# | Johnson% | Total |
|---|---|---|---|---|---|---|---|
| Adair | 4,753 | 73.5% | 1,374 | 21.2% | 341 | 5.3% | 6,468 |
| Alfalafa | 1,931 | 81.3% | 216 | 9.6% | 109 | 4.8% | 2,256 |
| Atoka | 4,068 | 81.3% | 795 | 15.9% | 139 | 2.8% | 5,002 |
| Beaver | 1,987 | 88.8% | 176 | 7.9% | 74 | 3.3% | 2,237 |
| Beckham | 6,287 | 83.5% | 958 | 12.7% | 284 | 3.8% | 7,529 |
| Blaine | 2,884 | 76.0% | 711 | 18.7% | 198 | 5.2% | 3,793 |
| Bryan | 10,449 | 75.9% | 2,793 | 20.3% | 533 | 3.9% | 13,775 |
| Caddo | 6,473 | 69.3% | 2,418 | 25.9% | 445 | 4.8% | 9,336 |
| Canadian | 39,969 | 72.3% | 11,666 | 21.1% | 3,615 | 6.5% | 55,250 |
| Carter | 13,751 | 74.2% | 4,002 | 21.6% | 780 | 4.2% | 18,533 |
| Cherokee | 9,992 | 60.6% | 5,445 | 33.1% | 1,040 | 6.3% | 16,487 |
| Choctaw | 4,202 | 77.5% | 1,064 | 19.6% | 153 | 2.8% | 5,419 |
| Cimarron | 962 | 89.3% | 70 | 6.5% | 45 | 4.2% | 1,077 |
| Cleveland | 62,469 | 57.1% | 38,790 | 35.5% | 8,067 | 7.4% | 109,326 |
| Coal | 1,892 | 79.1% | 411 | 17.2% | 90 | 3.8% | 2,393 |
| Comanche | 19,153 | 58.9% | 11,439 | 35.2% | 1,912 | 5.9% | |
| Cotton | 2,054 | 78.9% | 424 | 16.3% | 124 | 4.8% | |
| Craig | 4,279 | 74.1% | 1,249 | 21.6% | 250 | 4.3% | |
| Creek | 21,539 | 74.8% | 5,834 | 20.3% | 1,413 | 4.9% | |
| Custer | 7,818 | 74.2% | 2,102 | 20.0% | 611 | 5.8% | |
| Delaware | 11,796 | 75.2% | 3,306 | 21.1% | 578 | 3.7% | |
| Dewey | 1,964 | 87.4% | 222 | 9.9% | 60 | 2.7% | |
| Ellis | 1,610 | 88.2% | 155 | 8.5% | 61 | 3.3% | |
| Garfield | 15,998 | 73.8% | 4,391 | 20.2% | 1,303 | 6.0% | |
| Garvin | 8,243 | 78.3% | 1,852 | 17.6% | 436 | 4.1% | |
| Grady | 17,293 | 77.7% | 3,878 | 17.4% | 1,086 | 4.9% | |
| Grant | 1,827 | 83.0% | 287 | 13.0 | 86 | 4.0% | |
| Greer | 1,482 | 78.2% | 323 | 17.0% | 91 | 4.8% | |
| Harmon | 714 | 73.2% | 224 | 23.0% | 37 | 4.0% | |
| Harper | 1,307 | 88.0% | 131 | 8.8% | 47 | 3.2% | |
| Haskell | |||||||
| Hughes | |||||||
| Jackson | |||||||
| Jefferson | |||||||
| Johnston | |||||||
| Kay | |||||||
| Kingfisher | |||||||
| Kiowa | |||||||
| Latimer | |||||||
| Le Flore | |||||||
| Lincoln | |||||||
| Logan | |||||||
| Love | |||||||
| McClain | |||||||
| McCurtain | |||||||
| McIntosh | |||||||
| Major | |||||||
| Marshall | |||||||
| Mayes | |||||||
| Murray | |||||||
| Muskogee | |||||||
| Noble | |||||||
| Nowata | |||||||
| Okfuskee | |||||||
| Oklahoma | |||||||
| Okmulgee | |||||||
| Osage | |||||||
| Ottawa | |||||||
| Pawnee | |||||||
| Payne | |||||||
| Pittsburg | |||||||
| Pontotoc | |||||||
| Pottawatomie | |||||||
| Pushmataha | |||||||
| Roger Mills | |||||||
| Rogers | |||||||
| Seminole | |||||||
| Sequoyah | |||||||
| Stephens | |||||||
| Texas | |||||||
| Tillman | |||||||
| Tulsa | |||||||
| Wagoner | |||||||
| Washington | |||||||
| Washita | |||||||
| Woods | |||||||
| Woodward |
Primary elections
Democratic primary
- Results
| | |||||||||||||||||||||||||
| |||||||||||||||||||||||||
| |||||||||||||||||||||||||
|
| |||||||||||||||||||||||||
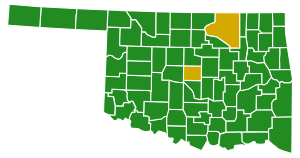
| Oklahoma results by county
Bernie Sanders
Hillary Clinton | |||||||||||||||||||||||||
| Oklahoma Democratic primary, March 1, 2016 | |||||
|---|---|---|---|---|---|
| Candidate | Popular vote | Estimated delegates | |||
| Count | Percentage | Pledged | Unpledged | Total | |
| Bernie Sanders | 174,228 | 51.88% | 21 | 1 | 22 |
| Hillary Clinton | 139,443 | 41.52% | 17 | 1 | 18 |
| Martin O'Malley (withdrawn) | 7,672 | 2.28% | |||
| Keith Russell Judd | 4,386 | 1.31% | |||
| Michael Alan Steinberg | 4,171 | 1.24% | |||
| Star Locke (withdrawn) | 3,458 | 1.03% | |||
| Rocky De La Fuente | 2,485 | 0.74% | |||
| Uncommitted | N/A | 0 | 2 | 2 | |
| Total | 335,843 | 100% | 38 | 4 | 42 |
| Source: The Green Papers, Oklahoma State Election Board | |||||
Republican primary
| | |||||||||||||||||||||||||||||||||||||||||||||||
| |||||||||||||||||||||||||||||||||||||||||||||||
| |||||||||||||||||||||||||||||||||||||||||||||||
|
| |||||||||||||||||||||||||||||||||||||||||||||||
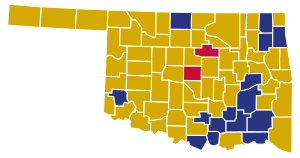
| Oklahoma results by county Ted Cruz Donald Trump Marco Rubio | |||||||||||||||||||||||||||||||||||||||||||||||
.jpg)
.jpg)

Twelve candidates appeared on the Republican presidential primary ballot:[4]
| Oklahoma Republican primary, March 1, 2016 | |||||
|---|---|---|---|---|---|
| Candidate | Votes | Percentage | Actual delegate count | ||
| Bound | Unbound | Total | |||
| 158,078 | 34.37% | 15 | 0 | 15 | |
| Donald Trump | 130,267 | 28.32% | 14 | 0 | 14 |
| Marco Rubio | 119,633 | 26.01% | 12 | 0 | 12 |
| Ben Carson | 28,601 | 6.22% | 0 | 0 | 0 |
| John Kasich | 16,524 | 3.59% | 0 | 0 | 0 |
| Jeb Bush (withdrawn) | 2,091 | 0.45% | 0 | 0 | 0 |
| Rand Paul (withdrawn) | 1,666 | 0.36% | 0 | 0 | 0 |
| Mike Huckabee (withdrawn) | 1,308 | 0.28% | 0 | 0 | 0 |
| Carly Fiorina (withdrawn) | 610 | 0.13% | 0 | 0 | 0 |
| Chris Christie (withdrawn) | 545 | 0.12% | 0 | 0 | 0 |
| Rick Santorum (withdrawn) | 375 | 0.08% | 0 | 0 | 0 |
| Lindsey Graham (withdrawn) | 224 | 0.05% | 0 | 0 | 0 |
| Unprojected delegates: | 2 | 0 | 2 | ||
| Total: | 459,922 | 100.00% | 43 | 0 | 43 |
| Source: The Green Papers | |||||
Polling
See also
| Elections in Oklahoma |
|---|
 |
- Democratic Party presidential debates, 2016
- Democratic Party presidential primaries, 2016
- Republican Party presidential debates, 2016
- Republican Party presidential primaries, 2016
References
External links
- RNC 2016 Republican Nominating Process
- Green papers for 2016 primaries, caucuses, and conventions
- 2016 Presidential primaries, ElectionProjection.com
- Decision Desk Headquarter Results for Oklahoma