United States House of Representatives elections in California, 2004
| | ||||||||||||||||||||||||||||||||||||||
| ||||||||||||||||||||||||||||||||||||||
| ||||||||||||||||||||||||||||||||||||||
|
| ||||||||||||||||||||||||||||||||||||||
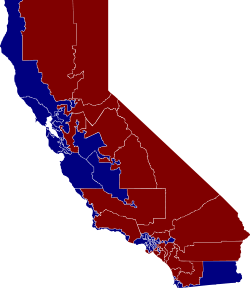
| Electoral results by congressional district | ||||||||||||||||||||||||||||||||||||||
| Elections in California | ||||||||||
|---|---|---|---|---|---|---|---|---|---|---|
 | ||||||||||
|
||||||||||
|
||||||||||
The United States House of Representatives elections in California, 2004 was an election for California's delegation to the United States House of Representatives, which occurred as part of the general election of the House of Representatives on November 2, 2004. The districts after the 2000 census were gerrymandered to protect incumbents of both parties, so there was no change in the party balance, 33 Democrats and 20 Republicans.
Overview
| United States HoR elections in California, 2004 | ||||||
|---|---|---|---|---|---|---|
| Party | Votes | % | Seats | |||
| Democratic | 6,223,698 | 53.54% | 33 | |||
| Republican | 5,030,821 | 43.28% | 20 | |||
| Green | 205,278 | 1.77% | 0 | |||
| Libertarian | 111,031 | 0.96% | 0 | |||
| Peace and Freedom | 39,211 | 0.34% | 0 | |||
| American Independent | 8,163 | 0.07% | 0 | |||
| Write-in | 5,551 | 0.05% | 0 | |||
| Totals | 11,623,753 | 100.00% | 53 | |||
Results
The following are the final results from the Secretary of State of California.[1][2]
|
District 1 • District 2 • District 3 • District 4 • District 5 • District 6 • District 7 • District 8 • District 9 • District 10 • District 11 • District 12 • District 13 • District 14 • District 15 • District 16 • District 17 • District 18 • District 19 • District 20 • District 21 • District 22 • District 23 • District 24 • District 25 • District 26 • District 27 • District 28 • District 29 • District 30 • District 31 • District 32 • District 33 • District 34 • District 35 • District 36 • District 37 • District 38 • District 39 • District 40 • District 41 • District 42 • District 43 • District 44 • District 45 • District 46 • District 47 • District 48 • District 49 • District 50 • District 51 • District 52 • District 53 |
District 1
| Party | Candidate | Votes | % | |
|---|---|---|---|---|
| Democratic | Mike Thompson (incumbent) | 189,366 | 66.92 | |
| Republican | Lawrence R. Wiesner | 79,970 | 28.26 | |
| Green | Pamela Elizondo | 13,635 | 4.82 | |
| Total votes | 282,971 | 100.00 | ||
| Voter turnout | % | |||
| Democratic hold | ||||
District 2
| Party | Candidate | Votes | % | |
|---|---|---|---|---|
| Republican | Wally Herger (incumbent) | 182,119 | 66.85 | |
| Democratic | Mike Johnson | 90,310 | 33.15 | |
| Total votes | 272,429 | 100.00 | ||
| Voter turnout | % | |||
| Republican hold | ||||
District 3
| Party | Candidate | Votes | % | |
|---|---|---|---|---|
| Republican | Dan Lungren | 177,738 | 61.92 | |
| Democratic | Gabe Castillo | 100,025 | 34.84 | |
| Libertarian | Douglas Arthur Tuma | 9,310 | 3.24 | |
| Total votes | 287,063 | 100.00 | ||
| Voter turnout | % | |||
| Republican hold | ||||
District 4
| Party | Candidate | Votes | % | |
|---|---|---|---|---|
| Republican | John Doolittle (incumbent) | 221,926 | 65.39 | |
| Democratic | David I. Winters | 117,743 | 34.69 | |
| Total votes | 339,369 | 100.00 | ||
| Voter turnout | % | |||
| Republican hold | ||||
District 5
| Party | Candidate | Votes | % | |
|---|---|---|---|---|
| Democratic | Robert Matsui (incumbent) | 138,004 | 71.36 | |
| Republican | Mike Dugas | 45,120 | 23.33 | |
| Green | Pat Driscoll | 6,593 | 3.41 | |
| Peace and Freedom | John C. Reiger | 3,670 | 1.90 | |
| Total votes | 193,387 | 100.00 | ||
| Voter turnout | % | |||
| Democratic hold | ||||
District 6
| Party | Candidate | Votes | % | |
|---|---|---|---|---|
| Democratic | Lynn Woolsey (incumbent) | 226,423 | 72.65 | |
| Republican | Paul L. Erickson | 85,244 | 27.35 | |
| Total votes | 311,667 | 100.00 | ||
| Voter turnout | % | |||
| Democratic hold | ||||
District 7
| Party | Candidate | Votes | % | |
|---|---|---|---|---|
| Democratic | George Miller (incumbent) | 166,831 | 76.08 | |
| Republican | Charles Hargrave | 52,446 | 23.92 | |
| Total votes | 219,277 | 100.00 | ||
| Voter turnout | % | |||
| Democratic hold | ||||
District 8
| Party | Candidate | Votes | % | |
|---|---|---|---|---|
| Democratic | Nancy Pelosi (incumbent) | 224,017 | 82.95 | |
| Republican | Jennifer Depalma | 31,074 | 11.51 | |
| Peace and Freedom | Leilani Dowell | 9,527 | 3.53 | |
| No party | Terry Baum (write-in) | 5,446 | 2.02% | |
| Total votes | 270,064 | 100.00 | ||
| Voter turnout | % | |||
| Democratic hold | ||||
District 9
| Party | Candidate | Votes | % | |
|---|---|---|---|---|
| Democratic | Barbara Lee (incumbent) | 215,630 | 84.55 | |
| Republican | Claudia Bermudez | 31,278 | 12.26 | |
| Libertarian | Jim Eyer | 8,131 | 3.19 | |
| Total votes | 255,039 | 100.00 | ||
| Voter turnout | % | |||
| Democratic hold | ||||
District 10
| Party | Candidate | Votes | % | |
|---|---|---|---|---|
| Democratic | Ellen Tauscher (incumbent) | 182,750 | 65.71 | |
| Republican | Jeff Ketelson | 95,349 | 34.29 | |
| Total votes | 278,099 | 100.00 | ||
| Voter turnout | % | |||
| Democratic hold | ||||
District 11
| Party | Candidate | Votes | % | |
|---|---|---|---|---|
| Republican | Richard Pombo (incumbent) | 163,582 | 61.23 | |
| Democratic | Jerry McNerney | 103,587 | 38.77 | |
| Total votes | 267,169 | 100.00 | ||
| Voter turnout | % | |||
| Republican hold | ||||
District 12
| Party | Candidate | Votes | % | |
|---|---|---|---|---|
| Democratic | Tom Lantos (incumbent) | 171,852 | 68.03 | |
| Republican | Mike Garza | 52,593 | 20.82 | |
| Green | Pat Gray | 23,038 | 9.12 | |
| Libertarian | Harland Harrison | 5,116 | 2.03 | |
| Total votes | 252,599 | 100.00 | ||
| Voter turnout | % | |||
| Democratic hold | ||||
District 13
| Party | Candidate | Votes | % | |
|---|---|---|---|---|
| Democratic | Pete Stark (incumbent) | 144,605 | 71.61 | |
| Republican | George I. Bruno | 48,439 | 23.99 | |
| Libertarian | Mark W. Stroberg | 8,877 | 4.40 | |
| Total votes | 201,921 | 100.00 | ||
| Voter turnout | % | |||
| Democratic hold | ||||
District 14
| Party | Candidate | Votes | % | |
|---|---|---|---|---|
| Democratic | Anna Eshoo (incumbent) | 182,712 | 69.77 | |
| Republican | Chris Haugen | 69,564 | 26.56 | |
| Libertarian | Brian Holtz | 9,588 | 3.66 | |
| No party | Dennis Mitrzyk (write-in) | 24 | 0.01% | |
| Total votes | 261,888 | 100.00 | ||
| Voter turnout | % | |||
| Democratic hold | ||||
District 15
| Party | Candidate | Votes | % | |
|---|---|---|---|---|
| Democratic | Mike Honda (incumbent) | 154,385 | 72.03 | |
| Republican | Raymond L. Chukwu | 59,953 | 27.97 | |
| Total votes | 214,338 | 100.00 | ||
| Voter turnout | % | |||
| Democratic hold | ||||
District 16
| Party | Candidate | Votes | % | |
|---|---|---|---|---|
| Democratic | Zoe Lofgren (incumbent) | 129,222 | 70.89 | |
| Republican | Douglas Adams McNea | 47,992 | 26.33 | |
| Libertarian | Markus Welch | 5,067 | 2.78 | |
| Total votes | 182,281 | 100.00 | ||
| Voter turnout | % | |||
| Democratic hold | ||||
District 17
| Party | Candidate | Votes | % | |
|---|---|---|---|---|
| Democratic | Sam Farr (incumbent) | 148,958 | 66.73 | |
| Republican | Mark Risley | 65,117 | 29.17 | |
| Green | Ray Glock-Grueneich | 3,645 | 1.63 | |
| Peace and Freedom | Joe Williams | 2,823 | 1.26 | |
| Libertarian | Joel Smolen | 2,607 | 1.17 | |
| No party | David Mauricio Munoz (write-in) | 75 | 0.03% | |
| Total votes | 223,225 | 100.00 | ||
| Voter turnout | % | |||
| Democratic hold | ||||
District 18
| Party | Candidate | Votes | % | |
|---|---|---|---|---|
| Democratic | Dennis Cardoza (incumbent) | 103,732 | 67.49 | |
| Republican | Charles F. Pringle, Sr. | 49,973 | 32.51 | |
| Total votes | 153,705 | 100.00 | ||
| Voter turnout | % | |||
| Democratic hold | ||||
District 19
| Party | Candidate | Votes | % | |
|---|---|---|---|---|
| Republican | George Radanovich (incumbent) | 155,354 | 66.03 | |
| Democratic | James Lex Bufford | 64,047 | 27.22 | |
| Green | Larry R. Mullen | 15,863 | 6.74 | |
| Total votes | 235,264 | 100.00 | ||
| Voter turnout | % | |||
| Republican hold | ||||
District 20
| Party | Candidate | Votes | % | |
|---|---|---|---|---|
| Democratic | Jim Costa | 61,005 | 53.40 | |
| Republican | Roy Ashburn | 53,231 | 46.60 | |
| Total votes | 114,236 | 100.00 | ||
| Voter turnout | % | |||
| Democratic hold | ||||
District 21
| Party | Candidate | Votes | % | |
|---|---|---|---|---|
| Republican | Devin Nunes (incumbent) | 140,721 | 73.17 | |
| Democratic | Fred B. Davis | 51,594 | 26.83 | |
| Total votes | 192,315 | 100.00 | ||
| Voter turnout | % | |||
| Republican hold | ||||
District 22
| Party | Candidate | Votes | % | |
|---|---|---|---|---|
| Republican | Bill Thomas (incumbent) | 209,384 | 100.00 | |
| Voter turnout | % | |||
| Republican hold | ||||
District 23
| Party | Candidate | Votes | % | |
|---|---|---|---|---|
| Democratic | Lois Capps (incumbent) | 153,980 | 63.03 | |
| Republican | Don Regan | 83,926 | 34.35 | |
| Libertarian | Michael Favorite | 6,391 | 2.62 | |
| Total votes | 244,297 | 100.00 | ||
| Voter turnout | % | |||
| Democratic hold | ||||
District 24
| Party | Candidate | Votes | % | |
|---|---|---|---|---|
| Republican | Elton Gallegly (incumbent) | 178,660 | 62.82 | |
| Democratic | Brett Wagner | 96,397 | 33.90 | |
| Green | Stuart A. Bechman | 9,321 | 3.28 | |
| Total votes | 284,378 | 100.00 | ||
| Voter turnout | % | |||
| Republican hold | ||||
District 25
| Party | Candidate | Votes | % | |
|---|---|---|---|---|
| Republican | Howard McKeon (incumbent) | 145,575 | 64.42 | |
| Democratic | Fred "Tim" Willoughby | 80,395 | 35.58 | |
| Total votes | 225,970 | 100.00 | ||
| Voter turnout | % | |||
| Republican hold | ||||
District 26
| Party | Candidate | Votes | % | |
|---|---|---|---|---|
| Republican | David Dreier (incumbent) | 134,596 | 53.58 | |
| Democratic | Cynthia Matthews | 107,522 | 42.80 | |
| Libertarian | Randall Weissbuch | 9,089 | 3.62 | |
| Total votes | 251,207 | 100.00 | ||
| Voter turnout | % | |||
| Republican hold | ||||
District 27
| Party | Candidate | Votes | % | |
|---|---|---|---|---|
| Democratic | Brad Sherman (incumbent) | 125,296 | 62.27 | |
| Republican | Robert M. Levy | 66,946 | 33.27 | |
| Green | Eric J. Carter | 8,956 | 4.45 | |
| Total votes | 201,198 | 100.00 | ||
| Voter turnout | % | |||
| Democratic hold | ||||
District 28
| Party | Candidate | Votes | % | |
|---|---|---|---|---|
| Democratic | Howard Berman (incumbent) | 115,303 | 70.95 | |
| Republican | David Hernandez | 37,868 | 23.30 | |
| Libertarian | Kelley L. Ross | 9,339 | 5.75 | |
| Total votes | 162,510 | 100.00 | ||
| Voter turnout | % | |||
| Democratic hold | ||||
District 29
| Party | Candidate | Votes | % | |
|---|---|---|---|---|
| Democratic | Adam Schiff (incumbent) | 133,670 | 64.63 | |
| Republican | Harry Scolinos | 62,871 | 30.40 | |
| Green | Philip Koebel | 5,715 | 2.76 | |
| Libertarian | Ted Brown | 4,570 | 2.21 | |
| No party | John Burton (write-in) | 6 | 0.00% | |
| Total votes | 206,832 | 100.00 | ||
| Voter turnout | % | |||
| Democratic hold | ||||
District 30
| Party | Candidate | Votes | % | |
|---|---|---|---|---|
| Democratic | Henry Waxman (incumbent) | 216,682 | 71.24 | |
| Republican | Victor Elizade | 87,465 | 28.76 | |
| Total votes | 304,147 | 100.00 | ||
| Voter turnout | % | |||
| Democratic hold | ||||
District 31
| Party | Candidate | Votes | % | |
|---|---|---|---|---|
| Democratic | Xavier Becerra (incumbent) | 89,363 | 80.21 | |
| Republican | Luis Vega | 22,048 | 19.79 | |
| Total votes | 111,411 | 100.00 | ||
| Voter turnout | % | |||
| Democratic hold | ||||
District 32
| Party | Candidate | Votes | % | |
|---|---|---|---|---|
| Democratic | Hilda Solis (incumbent) | 119,144 | 85.01 | |
| Libertarian | Leland Faegre | 21,002 | 14.99 | |
| Total votes | 140,146 | 100.00 | ||
| Voter turnout | % | |||
| Democratic hold | ||||
District 33
| Party | Candidate | Votes | % | |
|---|---|---|---|---|
| Democratic | Diane Watson (incumbent) | 166,801 | 88.58 | |
| Libertarian | Robert G. Weber, Jr. | 21,513 | 11.42 | |
| Total votes | 188,314 | 100.00 | ||
| Voter turnout | % | |||
| Democratic hold | ||||
District 34
| Party | Candidate | Votes | % | |
|---|---|---|---|---|
| Democratic | Lucille Roybal-Allard (incumbent) | 82,282 | 74.49 | |
| Republican | Wayne Miller | 28,175 | 25.51 | |
| Total votes | 110,457 | 100.00 | ||
| Voter turnout | % | |||
| Democratic hold | ||||
District 35
| Party | Candidate | Votes | % | |
|---|---|---|---|---|
| Democratic | Maxine Waters (incumbent) | 125,949 | 80.53 | |
| Republican | Ross Moen | 23,591 | 15.08 | |
| American Independent | Gordon Michael Mego | 3,440 | 2.20 | |
| Libertarian | Charles Tate | 3,427 | 2.19 | |
| Total votes | 156,407 | 100.00 | ||
| Voter turnout | % | |||
| Democratic hold | ||||
District 36
| Party | Candidate | Votes | % | |
|---|---|---|---|---|
| Democratic | Jane Harman (incumbent) | 151,208 | 61.96 | |
| Republican | Paul Whitehead | 81,666 | 33.46 | |
| Peace and Freedom | Alice Stek | 6,105 | 2.50 | |
| Libertarian | Mike Binkley | 5,065 | 2.08 | |
| Total votes | 244,044 | 100.00 | ||
| Voter turnout | % | |||
| Democratic hold | ||||
District 37
| Party | Candidate | Votes | % | |
|---|---|---|---|---|
| Democratic | Juanita Millender-McDonald (inc.) | 118,823 | 75.05 | |
| Republican | Vernon Van | 31,960 | 20.19 | |
| Libertarian | Herb Peters | 7,535 | 4.76 | |
| Total votes | 158,318 | 100.00 | ||
| Voter turnout | % | |||
| Democratic hold | ||||
District 38
| Party | Candidate | Votes | % | |
|---|---|---|---|---|
| Democratic | Grace Napolitano (incumbent) | 116,851 | 100.00 | |
| Voter turnout | % | |||
| Democratic hold | ||||
District 39
| Party | Candidate | Votes | % | |
|---|---|---|---|---|
| Democratic | Linda Sánchez (incumbent) | 100,132 | 60.70 | |
| Republican | Tim Escobar | 64,832 | 39.30 | |
| Total votes | 164,964 | 100.00 | ||
| Voter turnout | % | |||
| Democratic hold | ||||
District 40
| Party | Candidate | Votes | % | |
|---|---|---|---|---|
| Republican | Ed Royce (incumbent) | 147,617 | 67.93 | |
| Democratic | J. Tillman Williams | 69,684 | 32.07 | |
| Total votes | 217,301 | 100.00 | ||
| Voter turnout | % | |||
| Republican hold | ||||
District 41
| Party | Candidate | Votes | % | |
|---|---|---|---|---|
| Republican | Jerry Lewis (incumbent) | 181,605 | 82.95 | |
| Libertarian | Peymon Mottahedek | 37,332 | 17.05 | |
| Total votes | 218,937 | 100.00 | ||
| Voter turnout | % | |||
| Republican hold | ||||
District 42
| Party | Candidate | Votes | % | |
|---|---|---|---|---|
| Republican | Gary Miller (incumbent) | 167,632 | 68.14 | |
| Democratic | Lewis Myers | 78,393 | 31.86 | |
| Total votes | 246,025 | 100.00 | ||
| Voter turnout | % | |||
| Republican hold | ||||
District 43
| Party | Candidate | Votes | % | |
|---|---|---|---|---|
| Democratic | Joe Baca (incumbent) | 86,830 | 66.37 | |
| Republican | Ed Laning | 44,004 | 33.63 | |
| No party | Barry J. Patts (write-in) | 0 | 0.00% | |
| Total votes | 130,834 | 100.00 | ||
| Voter turnout | % | |||
| Democratic hold | ||||
District 44
| Party | Candidate | Votes | % | |
|---|---|---|---|---|
| Republican | Ken Calvert (incumbent) | 138,768 | 61.64 | |
| Democratic | Louis Vandenburg | 78,796 | 35.00 | |
| Peace and Freedom | Kevin Akin | 7,559 | 3.36 | |
| Total votes | 225,123 | 100.00 | ||
| Voter turnout | % | |||
| Republican hold | ||||
District 45
| Party | Candidate | Votes | % | |
|---|---|---|---|---|
| Republican | Mary Bono (incumbent) | 153,523 | 66.61 | |
| Democratic | Richard J. Meyer | 76,967 | 33.39 | |
| Total votes | 230,490 | 100.00 | ||
| Voter turnout | % | |||
| Republican hold | ||||
District 46
| Party | Candidate | Votes | % | |
|---|---|---|---|---|
| Republican | Dana Rohrabacher (incumbent) | 171,318 | 61.92 | |
| Democratic | Jim Brandt | 90,129 | 32.57 | |
| Green | Tom Lash | 10,238 | 3.70 | |
| Libertarian | Keith Gann | 5,005 | 1.81 | |
| Total votes | 276,690 | 100.00 | ||
| Voter turnout | % | |||
| Republican hold | ||||
District 47
| Party | Candidate | Votes | % | |
|---|---|---|---|---|
| Democratic | Loretta Sanchez (incumbent) | 65,684 | 60.38 | |
| Republican | Alexandria A. "Alex" Coronado | 43,099 | 39.62 | |
| Total votes | 108,783 | 100.00 | ||
| Voter turnout | % | |||
| Democratic hold | ||||
District 48
| Party | Candidate | Votes | % | |
|---|---|---|---|---|
| Republican | Christopher Cox (incumbent) | 189,004 | 64.98 | |
| Democratic | John Graham | 93,525 | 32.15 | |
| Libertarian | Bruce Cohen | 8,343 | 2.87 | |
| Total votes | 290,872 | 100.00 | ||
| Voter turnout | % | |||
| Republican hold | ||||
District 49
| Party | Candidate | Votes | % | |
|---|---|---|---|---|
| Republican | Darrell Issa (incumbent) | 141,658 | 62.55 | |
| Democratic | Michael P. Byron | 79,057 | 34.91 | |
| Libertarian | Lars R. Grossmith | 5,751 | 2.54 | |
| Total votes | 226,466 | 100.00 | ||
| Voter turnout | % | |||
| Republican hold | ||||
District 50
| Party | Candidate | Votes | % | |
|---|---|---|---|---|
| Republican | Duke Cunningham (incumbent) | 169,025 | 58.42 | |
| Democratic | Francine Busby | 105,590 | 36.49 | |
| Green | Gary M. Waayers | 6,504 | 2.25 | |
| American Independent | Diane Beall Templin | 4,723 | 1.63 | |
| Libertarian | Brandon C. Osborne | 3,486 | 1.20 | |
| Total votes | 289,328 | 100.00 | ||
| Voter turnout | % | |||
| Republican hold | ||||
District 51
| Party | Candidate | Votes | % | |
|---|---|---|---|---|
| Democratic | Bob Filner (incumbent) | 111,441 | 61.61 | |
| Republican | Michael Giorgino | 63,526 | 35.12 | |
| Libertarian | Michael S. Metti | 5,912 | 3.27 | |
| Total votes | 180,879 | 100.00 | ||
| Voter turnout | % | |||
| Democratic hold | ||||
District 52
| Party | Candidate | Votes | % | |
|---|---|---|---|---|
| Republican | Duncan Hunter (incumbent) | 187,799 | 69.19 | |
| Democratic | Brian S. Keliher | 74,857 | 27.58 | |
| Libertarian | Michael Benoit | 8,782 | 3.24 | |
| Total votes | 271,438 | 100.00 | ||
| Voter turnout | % | |||
| Republican hold | ||||
District 53
| Party | Candidate | Votes | % | |
|---|---|---|---|---|
| Democratic | Susan Davis (incumbent) | 146,449 | 66.14 | |
| Republican | David Hunzeker | 63,897 | 28.86 | |
| Green | Lawrence P. Rockwood | 7,523 | 3.40 | |
| Libertarian | Adam Van Susteren | 3,567 | 1.61 | |
| Total votes | 221,436 | 100.00 | ||
| Voter turnout | % | |||
| Democratic hold | ||||
References
- ↑ "United States Representative in Congress" (PDF). Secretary of State of California. 2004-12-13. Archived from the original (PDF) on August 21, 2008. Retrieved 2008-08-18.
- ↑ "Voter Participation Statistics by County" (PDF). Secretary of State of California. 2005-01-07. Retrieved 2008-08-18.
External links
- California Legislative District Maps (1911-Present)
- RAND California Election Returns: District Definitions
- 2004 General Election Returns for United States Congress
- California Elections Page
See also
- 109th United States Congress
- Political party strength in California
- Political party strength in U.S. states
- United States House of Representatives elections, 2004