Saint-Damase, Montérégie, Quebec
For the municipality in Bas-Saint-Laurent, see Saint-Damase, Bas-Saint-Laurent, Quebec.
| Saint-Damase | |
|---|---|
| Municipality | |
 | |
_Quebec_location_diagram.PNG) Location within Les Maskoutains RCM | |
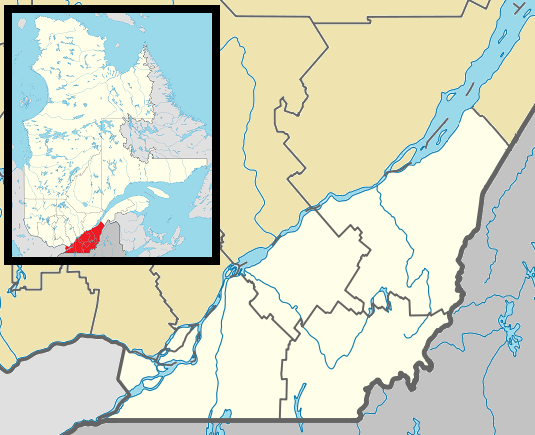 Saint-Damase Location in southern Quebec | |
| Coordinates: 45°32′N 73°00′W / 45.533°N 73.000°WCoordinates: 45°32′N 73°00′W / 45.533°N 73.000°W[1] | |
| Country |
|
| Province |
|
| Region | Montérégie |
| RCM | Les Maskoutains |
| Constituted | October 5, 2001 |
| Government[2][3] | |
| • Mayor | Germain Chabot |
| • Federal riding | Saint-Hyacinthe—Bagot |
| • Prov. riding | Saint-Hyacinthe |
| Area[2][4] | |
| • Total | 80.90 km2 (31.24 sq mi) |
| • Land | 79.07 km2 (30.53 sq mi) |
| Population (2011)[4] | |
| • Total | 2,506 |
| • Density | 31.7/km2 (82/sq mi) |
| • Pop 2006-2011 |
|
| • Dwellings | 1,025 |
| Time zone | EST (UTC−5) |
| • Summer (DST) | EDT (UTC−4) |
| Postal code(s) | J0H 1J0 |
| Area code(s) | 450 and 579 |
| Highways |
|
| Website |
www |
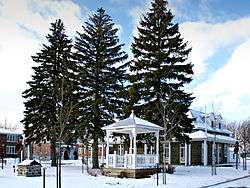
Saint-Damase is a municipality located in Les Maskoutains Regional County Municipality in the Montérégie region of Quebec. The population as of the Canada 2011 Census was 2,506. The municipality was created on October 5, 2001, by the merger of the Parish and the Village of Saint-Damase.
Demographics
Population
| Canada census – Saint-Damase, Montérégie, Quebec community profile | |||
|---|---|---|---|
| 2011 | 2006 | ||
| Population: | 2,506 (+0.8% from 2006) | 2,486 (-0.6% from 2001) | |
| Land area: | 79.07 km2 (30.53 sq mi) | 79.07 km2 (30.53 sq mi) | |
| Population density: | 31.7/km2 (82/sq mi) | 31.4/km2 (81/sq mi) | |
| Median age: | 41.3 (M: 41.1, F: 41.4) | 40.9 (M: 40.2, F: 41.6) | |
| Total private dwellings: | 1,025 | 983 | |
| Median household income: | $65,287 | $49,555 | |
| References: 2011[4] 2006[5] | |||
| Historical Census Data - Saint-Damase, Quebec[6] | ||||||||||||||||||||
|---|---|---|---|---|---|---|---|---|---|---|---|---|---|---|---|---|---|---|---|---|
|
|
| ||||||||||||||||||
(M) merger of Parish and Village of Saint-Damase on October 5, 2001. | ||||||||||||||||||||
| Historical Census Data - Saint-Damase (village), Quebec[6] | ||||||||||||||||||||
|---|---|---|---|---|---|---|---|---|---|---|---|---|---|---|---|---|---|---|---|---|
|
|
| ||||||||||||||||||
| Historical Census Data - Saint-Damase (parish), Quebec[6] | ||||||||||||||||||||
|---|---|---|---|---|---|---|---|---|---|---|---|---|---|---|---|---|---|---|---|---|
|
|
| ||||||||||||||||||
Language
| Canada Census Mother Tongue - Saint-Damase, Quebec[6] | ||||||||||||||||||
|---|---|---|---|---|---|---|---|---|---|---|---|---|---|---|---|---|---|---|
| Census | Total | French |
English |
French & English |
Other | |||||||||||||
| Year | Responses | Count | Trend | Pop % | Count | Trend | Pop % | Count | Trend | Pop % | Count | Trend | Pop % | |||||
| 2011 |
2,500 |
2,460 | |
98.40% | 15 | |
0.60% | 5 | |
0.20% | 20 | |
0.80% | |||||
| 2006 |
2,465 |
2,435 | |
98.78% | 10 | |
0.41% | 0 | |
0.00% | 20 | |
0.81% | |||||
| 2001 |
2,485 |
2.420 | n/a | 97.38% | 35 | n/a | 1.41% | 0 | n/a | 0.00% | 30 | n/a | 1.21% | |||||
See also
- List of municipalities in Quebec
- Jewish Colonies in Canada Accessed October 22, 2012
References
- ↑ Reference number 370954 of the Commission de toponymie du Québec (French)
- 1 2 Ministère des Affaires municipales, des Régions et de l'Occupation du territoire: Saint-Damase (Montérégie)
- ↑ Parliament of Canada Federal Riding History: SAINT-HYACINTHE--BAGOT (Quebec)
- 1 2 3 2011 Statistics Canada Census Profile: Saint-Damase, (Montérégie), Quebec
- ↑ "2006 Community Profiles". Canada 2006 Census. Statistics Canada. March 30, 2011. Retrieved 2014-03-18.
- 1 2 3 4 Statistics Canada: 1996, 2001, 2006, 2011 census
| Wikimedia Commons has media related to Saint-Damase, Montérégie, Quebec. |
 |
Sainte-Marie-Madeleine | Saint-Hyacinthe | | |
| Saint-Jean-Baptiste | |
Saint-Pie | ||
| ||||
| | ||||
| Rougemont | Saint-Césaire |
| Cities | |
|---|---|
| Municipalities | |
| Parishes | |
| Villages | |
| |
This article is issued from Wikipedia - version of the 4/9/2014. The text is available under the Creative Commons Attribution/Share Alike but additional terms may apply for the media files.