Oldham Metropolitan Borough Council election, 2007
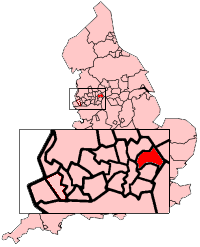
The Metropolitan Borough of Oldham shown within England.
Elections to Oldham Metropolitan Borough Council were held on 3 May 2007. One third of the Council was up for election.
The Labour Party lost overall control of the Council.
After the election, the composition of the council was
Election result
| Oldham Local Election Result 2007 | ||||||||||
|---|---|---|---|---|---|---|---|---|---|---|
| Party | Seats | Gains | Losses | Net gain/loss | Seats % | Votes % | Votes | +/− | ||
| Liberal Democrat | 9 | 1 | 2 | -1 | 36.3 | 20,876 | +2.3 | |||
| Labour | 9 | 2 | 3 | -1 | 34.6 | 19,863 | +5.1 | |||
| Conservative | 2 | 2 | 0 | +2 | 21.1 | 12,147 | +0.1 | |||
| BNP | 0 | 0 | 0 | 2.9 | 1,683 | -2.1 | ||||
| Green | 0 | 0 | 0 | 2.4 | 1,367 | -3.4 | ||||
| Independent | 0 | 0 | 0 | 1.7 | 967 | -3.0 | ||||
| UKIP | 0 | 0 | 0 | 0.9 | 541 | +0.9 | ||||
Ward results
Alexandra ward
| Party | Candidate | Votes | % | ± | |
|---|---|---|---|---|---|
| Labour | Glynis Shaw | 906 | 44.1 | +0.2 | |
| Liberal Democrat | Martin Dinoff | 765 | 37.2 | +7.6 | |
| Conservative | Paul Stephenson | 244 | 11.9 | +0.4 | |
| Green | Kay Roney | 139 | 6.8 | -0.2 | |
| Majority | 141 | 6.9 | -7.4 | ||
| Turnout | 2,054 | ||||
| Labour hold | Swing | ||||
Chadderton Central ward
| Party | Candidate | Votes | % | ± | |
|---|---|---|---|---|---|
| Conservative | Eileen Hulme | 1,218 | 51.2 | +19.2 | |
| Labour | Tony Brownridge | 997 | 41.9 | +3.3 | |
| Liberal Democrat | Mohammed Ali | 164 | 6.9 | -8.7 | |
| Majority | 221 | 9.3 | |||
| Turnout | 2,379 | ||||
| Conservative gain from Labour | Swing | ||||
Chadderton North ward
| Party | Candidate | Votes | % | ± | |
|---|---|---|---|---|---|
| Conservative | Len Quinn | 1,266 | 44.0 | -4.1 | |
| Labour | Susan Dean | 983 | 34.2 | -2.1 | |
| Liberal Democrat | Nazia Raja | 317 | 11.0 | +1.0 | |
| Independent | Eric Trigg | 160 | 5.6 | +5.6 | |
| UKIP | David Short | 150 | 5.2 | +5.2 | |
| Majority | 293 | 9.8 | -2.0 | ||
| Turnout | 2,876 | ||||
| Conservative gain from Labour | Swing | ||||
Chadderton South ward
| Party | Candidate | Votes | % | ± | |
|---|---|---|---|---|---|
| Labour | David Jones | 1,080 | 44.4 | +0.3 | |
| Conservative | John Berry | 602 | 24.7 | -5.0 | |
| BNP | Martin Brierley | 483 | 19.8 | +19.8 | |
| Liberal Democrat | Pat Lord | 170 | 11.1 | +0.6 | |
| Majority | 478 | 20.5 | +6.1 | ||
| Turnout | 2,335 | ||||
| Labour hold | Swing | ||||
Coldhurst ward
| Party | Candidate | Votes | % | ± | |
|---|---|---|---|---|---|
| Liberal Democrat | Jilad Miah | 1,753 | 43.2 | -6.5 | |
| Labour | Mohammed Islam | 1,378 | 33.5 | +10.8 | |
| Conservative | Abu Choudhury | 654 | 16.1 | -11.5 | |
| Independent | Nuruz Zaman | 220 | 5.4 | +5.4 | |
| Independent | Giash Uddin | 55 | 1.4 | +1.4 | |
| Majority | 375 | 9.2 | -12.9 | ||
| Turnout | 4,060 | ||||
| Liberal Democrat hold | Swing | ||||
Crompton ward
| Party | Candidate | Votes | % | ± | |
|---|---|---|---|---|---|
| Liberal Democrat | John Dillon | 1,550 | 55.6 | +1.5 | |
| Conservative | David Dunning | 606 | 21.7 | -4.2 | |
| Labour | Wyn Dillon | 476 | 17.1 | +5.0 | |
| Green | Fiona Southall | 157 | 5.6 | -2.3 | |
| Majority | 944 | 33.8 | +5.7 | ||
| Turnout | 2,789 | ||||
| Liberal Democrat hold | Swing | ||||
Failsworth East ward
| Party | Candidate | Votes | % | ± | |
|---|---|---|---|---|---|
| Labour | Jim McMahon | 1,476 | 57.9 | +9.8 | |
| Conservative | Paul Martin | 825 | 32.3 | +0.7 | |
| Green | John Parker | 154 | 6.0 | -8.0 | |
| Liberal Democrat | Dorothy Shaw | 96 | 3.8 | -2.5 | |
| Majority | 651 | 25.5 | +9.0 | ||
| Turnout | 2,551 | ||||
| Labour hold | Swing | ||||
Failsworth West ward
| Party | Candidate | Votes | % | ± | |
|---|---|---|---|---|---|
| Labour | Glenys Butterworth | 881 | 36.2 | -13.2 | |
| Conservative | Ian Barker | 735 | 30.2 | +9.3 | |
| Green | Warren Bates | 691 | 28.4 | +5.9 | |
| Liberal Democrat | Keith Taylor | 124 | 5.1 | -2.1 | |
| Majority | 146 | 6.0 | -20.9 | ||
| Turnout | 2,431 | ||||
| Labour hold | Swing | ||||
Hollinwood ward
| Party | Candidate | Votes | % | ± | |
|---|---|---|---|---|---|
| Liberal Democrat | Keith Pendlebury | 943 | 42.3 | +1.4 | |
| Labour | Steve Williams | 905 | 40.6 | +3.9 | |
| Conservative | David McDonald | 285 | 12.8 | -1.5 | |
| Green | David Roney | 94 | 4.2 | -4.0 | |
| Majority | 38 | 1.7 | -2.5 | ||
| Turnout | 2,227 | ||||
| Liberal Democrat gain from Labour | Swing | ||||
Medlock Vale ward
| Party | Candidate | Votes | % | ± | |
|---|---|---|---|---|---|
| Labour | Ged Ball | 1,284 | 58.2 | +23.7 | |
| Conservative | Ken Heeks | 490 | 22.2 | +15.6 | |
| Liberal Democrat | Philip Bagley | 431 | 19.5 | -14.5 | |
| Majority | 794 | 36.0 | +35.5 | ||
| Turnout | 2,205 | ||||
| Labour hold | Swing | ||||
Royton North ward
| Party | Candidate | Votes | % | ± | |
|---|---|---|---|---|---|
| Labour | Tony Larkin | 1,207 | 40.3 | +2.2 | |
| Conservative | Joseph Farquhar | 905 | 30.2 | +5.0 | |
| BNP | Anita Corbett | 486 | 16.2 | -8.8 | |
| Liberal Democrat | Philip Renold | 268 | 9.0 | -2.7 | |
| UKIP | Trevor Hilton | 126 | 4.2 | +4.2 | |
| Majority | 302 | 10.1 | -2.8 | ||
| Turnout | 2,992 | ||||
| Labour hold | Swing | ||||
Royton South ward
| Party | Candidate | Votes | % | ± | |
|---|---|---|---|---|---|
| Labour | Steven Bashforth | 1,079 | 37.1 | +9.6 | |
| Liberal Democrat | Sue Barratt | 968 | 33.3 | +0.1 | |
| Conservative | Allan Fish | 598 | 20.5 | +2.2 | |
| UKIP | Chris Shyne | 265 | 9.1 | +9.1 | |
| Majority | 129 | 4.4 | |||
| Turnout | 2,910 | ||||
| Labour hold | Swing | ||||
Saddleworth North ward
| Party | Candidate | Votes | % | ± | |
|---|---|---|---|---|---|
| Liberal Democrat | Derek Heffernan | 1,813 | 55.7 | +0.0 | |
| Conservative | Barbara Jackson | 794 | 24.4 | -0.3 | |
| Labour | Ken Hulme | 650 | 20.0 | +6.8 | |
| Majority | 1,019 | 31.3 | +1.2 | ||
| Turnout | 3,257 | ||||
| Liberal Democrat hold | Swing | ||||
Saddleworth South ward
| Party | Candidate | Votes | % | ± | |
|---|---|---|---|---|---|
| Liberal Democrat | Christine Wheeler | 2,079 | 55.1 | +2.4 | |
| Conservative | John Hudson | 1,211 | 32.1 | -1.6 | |
| Labour | Brian Ames | 265 | 7.0 | +0.0 | |
| Independent | Christine Beaumont-Rydings | 220 | 5.8 | +5.8 | |
| Majority | 868 | 23.0 | +4.0 | ||
| Turnout | 3,775 | ||||
| Liberal Democrat hold | Swing | ||||
Saddleworth West and Lees ward
| Party | Candidate | Votes | % | ± | |
|---|---|---|---|---|---|
| Liberal Democrat | Brian Lord | 1,571 | 55.0 | +12.5 | |
| Conservative | Graham Sheldon | 747 | 26.2 | +1.6 | |
| Labour | Paul Hickling | 537 | 18.8 | -2.5 | |
| Majority | 824 | 28.9 | +9.6 | ||
| Turnout | 2,855 | ||||
| Liberal Democrat hold | Swing | ||||
St James ward
| Party | Candidate | Votes | % | ± | |
|---|---|---|---|---|---|
| Liberal Democrat | James McArdle | 1,014 | 52.5 | +15.4 | |
| Labour | Adrian Alexander | 636 | 30.0 | +6.6 | |
| BNP | Craig Lawton | 371 | 17.5 | -2.9 | |
| Majority | 378 | 18.7 | +5.0 | ||
| Turnout | 2,021 | ||||
| Liberal Democrat hold | Swing | ||||
St Marys ward
| Party | Candidate | Votes | % | ± | |
|---|---|---|---|---|---|
| Labour | Shadab Qumer | 2,236 | 52.2 | +32.6 | |
| Liberal Democrat | Mohammed Masud | 2,044 | 47.8 | +21.2 | |
| Majority | 192 | 4.5 | |||
| Turnout | 4,280 | ||||
| Labour gain from Liberal Democrat | Swing | ||||
Shaw ward
| Party | Candidate | Votes | % | ± | |
|---|---|---|---|---|---|
| Liberal Democrat | Mark Alcock | 1,472 | 55.9 | +15.0 | |
| Labour | Dilys Fletcher | 350 | 13.3 | -0.3 | |
| BNP | Alwyn Stott | 343 | 13.0 | -3.0 | |
| Conservative | Kevin Howard | 337 | 12.8 | +3.1 | |
| Independent | David Bentley | 131 | 5.0 | -13.6 | |
| Majority | 1,122 | 42.6 | +20.3 | ||
| Turnout | 2,633 | ||||
| Liberal Democrat hold | Swing | ||||
Waterhead ward
| Party | Candidate | Votes | % | ± | |
|---|---|---|---|---|---|
| Liberal Democrat | Kay Knox | 1,556 | 62.0 | +13.2 | |
| Labour | Jennifer Harrison | 642 | 25.6 | -5.8 | |
| Independent | Stuart Allsopp | 181 | 7.2 | -1.2 | |
| Green | Stuart Fielding | 132 | 5.3 | -1.9 | |
| Majority | 914 | 36.4 | +19.0 | ||
| Turnout | 2,511 | ||||
| Liberal Democrat hold | Swing | ||||
Werneth ward
| Party | Candidate | Votes | % | ± | |
|---|---|---|---|---|---|
| Labour | Javid Iqbal | 1,895 | 46.2 | -2.4 | |
| Liberal Democrat | Khurshid Ahmed | 1,578 | 38.5 | -4.5 | |
| Conservative | Mohammed Jahan | 630 | 15.4 | +7.0 | |
| Majority | 317 | 7.7 | +2.1 | ||
| Turnout | 4,103 | ||||
| Labour gain from Liberal Democrat | Swing | ||||
References
| Mayor | |
|---|---|
| Bolton | |
| Bury | |
| Manchester | |
| Oldham | |
| Rochdale | |
| Salford | |
| Stockport | |
| Tameside | |
| Trafford | |
| Wigan | |
| County Council |
|
| |
This article is issued from Wikipedia - version of the 11/9/2015. The text is available under the Creative Commons Attribution/Share Alike but additional terms may apply for the media files.