Bury Metropolitan Borough Council election, 2016
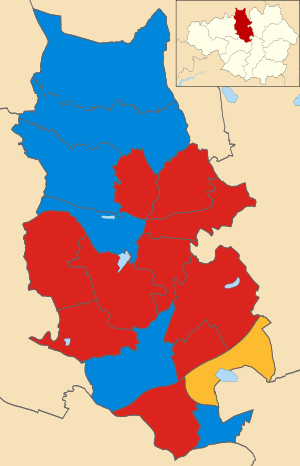
2016 local election results in Bury
The 2016 Bury Metropolitan Borough Council election took place on 5 May 2016 to elect members of Bury Metropolitan Borough Council in England.[1] This was on the same day as other local elections.
17 seats were contested. The Labour Party won 10 seats, the Conservatives won 6 seats, and the Liberal Democrats won 1 seat.
After the election, the total composition of the council was as follows:
- Labour 32
- Conservative 16
- Liberal Democrats 3
Election result
| Bury Local Election Result 2016 | ||||||||||
|---|---|---|---|---|---|---|---|---|---|---|
| Party | Seats | Gains | Losses | Net gain/loss | Seats % | Votes % | Votes | +/− | ||
| Labour | 10 | 1 | 3 | -2 | ||||||
| Conservative | 6 | 2 | 0 | +2 | ||||||
| UKIP | 0 | 0 | 0 | 0 | ||||||
| Liberal Democrat | 3 | 1 | 0 | +1 | ||||||
| Green | 0 | 0 | 1 | -1 | 0 | |||||
| English Democrat | 0 | 0 | 0 | 0 | 0 | |||||
| Independent | 0 | 0 | 1 | -1 | 0 | |||||
Ward results
| Party | Candidate | Votes | % | ± | |
|---|---|---|---|---|---|
| Labour | Elizabeth Fitzgerald | 1,426 | 58.7 | +6.0 | |
| Conservative | David Lewis | 486 | 20.0 | -2.4 | |
| English Democrat | Stephen Morris | 280 | 11.5 | +10.2 | |
| Green | Joanne Gardner | 132 | 3.6 | +1.8 | |
| Liberal Democrat | Katriona Middleton | 106 | 4.0 | +0.4 | |
| Majority | 940 | ||||
| Turnout | |||||
| Labour hold | Swing | ||||
| Party | Candidate | Votes | % | ± | |
|---|---|---|---|---|---|
| Conservative | Roy-Edward Walker | 2,061 | 59.8 | +11.6 | |
| Labour | Gavin McGill | 1,102 | 31.9 | -0.9 | |
| Green | Andrew Hunt | 188 | 5.5 | +2.3 | |
| Liberal Democrat | Rodney Rew | 97 | 2.8 | +0.1 | |
| Majority | 959 | ||||
| Turnout | |||||
| Conservative hold | Swing | ||||
| Party | Candidate | Votes | % | ± | |
|---|---|---|---|---|---|
| Labour | Stella Smith | 1,566 | 63.5 | +3.5 | |
| Conservative | Tahira Shaffi | 616 | 24.9 | +8.3 | |
| Green | Glyn Heath | 286 | 11.6 | +6.8 | |
| Majority | 950 | ||||
| Turnout | |||||
| Labour hold | Swing | ||||
| Party | Candidate | Votes | % | ± | |
|---|---|---|---|---|---|
| Labour | Susan Southworth | 1,418 | 41.8 | +1.6 | |
| Conservative | Dene Vernon | 1,312 | 38.6 | -0.5 | |
| UKIP | Dave Bentley | 465 | 13.7 | -1.2 | |
| Green | Charlotte Allen | 123 | 3.6 | +0.3 | |
| Liberal Democrat | Jacob Royde | 77 | 2.3 | -0.2 | |
| Majority | 106 | ||||
| Turnout | |||||
| Labour hold | Swing | ||||
| Party | Candidate | Votes | % | ± | |
|---|---|---|---|---|---|
| Liberal Democrat | Steve Wright | 1,733 | 45.1 | +9.5 | |
| Labour | Paddy Heneghan | 1,463 | 38.1 | +3.2 | |
| Conservative | Nicholas Jones | 280 | 7.3 | -5.9 | |
| UKIP | Michael Zwierzanski | 229 | 5.9 | -4.6 | |
| Green | Janneke Calle | 139 | 3.6 | -2.1 | |
| Majority | 270 | ||||
| Turnout | |||||
| Liberal Democrat gain from Labour | Swing | ||||
| Party | Candidate | Votes | % | ± | |
|---|---|---|---|---|---|
| Labour | Annette McKay | 1,375 | 51.3 | +0.9 | |
| UKIP | Victor Hagan | 569 | 21.2 | +1.4 | |
| Conservative | Luis McBriar | 511 | 19.1 | -5.8 | |
| Green | Larissa Heath | 135 | 5 | +0.1 | |
| Liberal Democrat | Samantha Stretch | 90 | 3.4 | +3.4 | |
| Majority | 806 | ||||
| Turnout | |||||
| Labour hold | Swing | ||||
| Party | Candidate | Votes | % | ± | |
|---|---|---|---|---|---|
| Conservative | Dorothy Gunther | 2,281 | 60.8 | +11.8 | |
| Labour | Timothy Butcher | 1,066 | 28.4 | +1.1 | |
| Green | Mary Heath | 225 | 6 | +0.4 | |
| Liberal Democrat | Ewan Arthur | 179 | 4.8 | -0.7 | |
| Majority | 1,215 | ||||
| Turnout | |||||
| Conservative hold | Swing | ||||
| Party | Candidate | Votes | % | ± | |
|---|---|---|---|---|---|
| Conservative | Oliver Kersh | 1,760 | 54.9 | +5 | |
| Labour | Debra Green | 1,197 | 37.3 | +1.8 | |
| Liberal Democrat | Wilfred Davison | 134 | 4.2 | +4.2 | |
| Green | Zachery Garsia | 114 | 3.6 | -1.4 | |
| Majority | 563 | ||||
| Turnout | |||||
| Conservative hold | Swing | ||||
| Party | Candidate | Votes | % | ± | |
|---|---|---|---|---|---|
| Labour | Rhyse Cathcart | 1,242 | 49.6 | +11.9 | |
| UKIP | Phil Husband | 506 | 20.2 | -0.6 | |
| Conservative | Zain Shah | 432 | 17.3 | -9.1 | |
| Green | Niamh McGarry-Gribbin | 180 | 7.2 | +2.3 | |
| Liberal Democrat | Robert Graham | 142 | 5.7 | +1.5 | |
| Majority | 736 | ||||
| Turnout | |||||
| Labour gain from Green | Swing | ||||
| Party | Candidate | Votes | % | ± | |
|---|---|---|---|---|---|
| Labour | Sharon Briggs | 1,456 | 46.8 | +7.5 | |
| Conservative | Carl Curran | 1,000 | 32.2 | +1.1 | |
| UKIP | Michael Zwierzanski | 539 | 17.3 | -5.0 | |
| Green | Matthew Bailey | 113 | 3.6 | +0.2 | |
| Majority | 456 | ||||
| Turnout | |||||
| Labour hold | Swing | ||||
| Party | Candidate | Votes | % | ± | |
|---|---|---|---|---|---|
| Labour | Tony Cummings | 1,303 | 46.8 | +0.9 | |
| Conservative | Liam Dean | 458 | 32.2 | +3.7 | |
| UKIP | Ian Henderson | 438 | 17.3 | -3.2 | |
| Green | Karen Wood | 83 | 3.5 | -0.6 | |
| Liberal Democrat | Kamran Islam | 53 | 2.3 | +0.4 | |
| Majority | 845 | ||||
| Turnout | |||||
| Labour hold | Swing | ||||
| Party | Candidate | Votes | % | ± | |
|---|---|---|---|---|---|
| Conservative | Ian Schofield | 1,695 | 43.8 | -3.3 | |
| Labour | Karen Leach | 1,658 | 42.9 | +7.7 | |
| UKIP | David Barker | 372 | 9.6 | +1.9 | |
| Green | Zarrin Shannon | 141 | 3.6 | +2.6 | |
| Majority | 37 | ||||
| Turnout | |||||
| Conservative gain from Labour | Swing | ||||
| Party | Candidate | Votes | % | ± | |
|---|---|---|---|---|---|
| Labour | Shaheena Haroon | 1,729 | 58.3 | +5.3 | |
| Conservative | Julie Green | 867 | 29.3 | +3.8 | |
| Green | Paul Johnstone | 367 | 3.4 | +9.0 | |
| Majority | 862 | ||||
| Turnout | |||||
| Labour hold | Swing | ||||
| Party | Candidate | Votes | % | ± | |
|---|---|---|---|---|---|
| Conservative | David Silbiger | 1,693 | 45.4 | +9.4 | |
| Labour | Andrea Simpson | 1,633 | 43.8 | +/-0.0 | |
| Liberal Democrat | Elizabeth Clayton | 233 | 6.3 | -0.4 | |
| Green | Kamila Liang | 168 | 4.5 | -0.8 | |
| Majority | 60 | ||||
| Turnout | |||||
| Conservative gain from Labour | Swing | ||||
| Party | Candidate | Votes | % | ± | |
|---|---|---|---|---|---|
| Labour | Jane Black | 1,349 | 41.3 | +1.1 | |
| Liberal Democrat | Michael Powell | 1,330 | 40.7 | +17.3 | |
| Conservative | Danny Franks | 463 | 14.2 | -5.6 | |
| Green | Jozias Bailey-Sharam | 126 | 3.8 | -2.2 | |
| Majority | 19 | ||||
| Turnout | |||||
| Labour hold | Swing | ||||
| Party | Candidate | Votes | % | ± | |
|---|---|---|---|---|---|
| Conservative | Greg Keeley | 1,367 | 46.6 | -2.2 | |
| Labour | Martin Hayes | 929 | 31.7 | +2.8 | |
| UKIP | Hazel Gorman | 417 | 14.2 | -0.1 | |
| Liberal Democrat | David Foss | 116 | 4.0 | +0.5 | |
| Green | Carmel Walker | 103 | 3.5 | -1.0 | |
| Majority | 438 | ||||
| Turnout | |||||
| Conservative hold | Swing | ||||
| Party | Candidate | Votes | % | ± | |
|---|---|---|---|---|---|
| Labour | David Jones | 1,365 | 48.0 | +2.8 | |
| Conservative | Bernard Vincent | 885 | 31.2 | -3.1 | |
| UKIP | Tony Clough | 411 | 14.5 | +1.5 | |
| Liberal Democrat | Steve Middleton | 114 | 4.0 | +0.3 | |
| Green | Nicola Haydock | 66 | 2.3 | -1.0 | |
| Majority | 480 | ||||
| Turnout | |||||
| Labour hold | Swing | ||||
References
- ↑ "Guide to May 2016 elections in Scotland, Wales, England and Northern Ireland". BBC News. Retrieved 21 April 2016.
| Mayor | |
|---|---|
| Bolton | |
| Bury | |
| Manchester | |
| Oldham | |
| Rochdale | |
| Salford | |
| Stockport | |
| Tameside | |
| Trafford | |
| Wigan | |
| County Council |
|
| |
This article is issued from Wikipedia - version of the 10/30/2016. The text is available under the Creative Commons Attribution/Share Alike but additional terms may apply for the media files.