Wigan Metropolitan Borough Council election, 1979
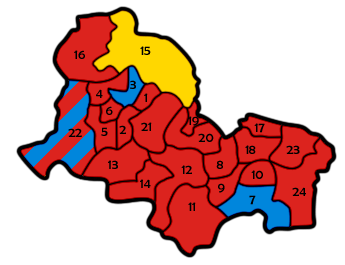
Elections to Wigan Council were held on 3 May 1979, with one third of the council up for vote as well as an extra vacancy in Ward 22. The election seen Labour strengthening their grip, with six gains - mostly in the wards they lost seats in at the 1975 election - and one loss. All but one of the gains were from the Conservatives, with the other being from the Liberal's sole seat in Ward 14. A Liberal gain in Ward 15 from Labour kept them represented on the council. Owing to general election on the same day, turnout was significantly up, to 75.7% and all wards were contested - a continuation of the feat started last election.[1]
Election result
| Wigan Local Election Result 1979 |
| Party |
Seats |
Gains |
Losses |
Net gain/loss |
Seats % |
Votes % |
Votes |
+/− |
| |
Labour |
21 |
6 |
1 |
+5 |
84.0 |
55.7 |
96,617 |
+1.4% |
| |
Conservative |
3 |
0 |
5 |
-5 |
12.0 |
37.9 |
65,756 |
-5.7% |
| |
Liberal |
1 |
1 |
1 |
0 |
4.0 |
5.0 |
8,646 |
+3.3% |
| |
Residents |
0 |
0 |
0 |
0 |
0.0 |
1.3 |
2,328 |
+1.3% |
| |
Communist |
0 |
0 |
0 |
0 |
0.0 |
0.1 |
154 |
-0.1% |
This result had the following consequences for the total number of seats on the Council after the elections:
| Party |
Previous council |
New council |
|
Labour |
51 |
56 |
|
Conservatives |
19 |
14 |
|
Liberals |
1 |
1 |
|
Independent |
1 |
1 |
| Total |
72 |
72 |
| Working majority |
30 |
40 |
Ward results
Ward 4 (Beech Hill and Marsh Green)[1]
| Party |
Candidate |
Votes |
% |
± |
|
Labour |
N. Turner |
4,869 |
70.7 |
+2.2 |
|
Conservative |
W. Banister |
2,016 |
29.3 |
-2.2 |
| Majority |
2,853 |
41.4 |
+4.4 |
| Turnout |
6,885 |
72.7 |
+43.3 |
|
Labour hold |
Swing |
+2.2 |
|
Ward 5 (Highfield and Lamberhead)[1]
| Party |
Candidate |
Votes |
% |
± |
|
Labour |
J. Smith |
4,886 |
59.0 |
+6.6 |
|
Conservative |
A. Foster |
3,395 |
41.0 |
-6.6 |
| Majority |
1,491 |
18.0 |
+13.2 |
| Turnout |
8,281 |
73.3 |
+47.2 |
|
Labour hold |
Swing |
+6.6 |
|
Ward 6 (Newtown and Rose Hill)[1]
| Party |
Candidate |
Votes |
% |
± |
|
Labour |
M. Milligan |
4,327 |
70.3 |
+3.7 |
|
Conservative |
R. Bell |
1,830 |
29.7 |
-3.7 |
| Majority |
2,497 |
40.6 |
+7.5 |
| Turnout |
6,157 |
71.4 |
+43.7 |
|
Labour hold |
Swing |
+3.7 |
|
Ward 8 (St Pauls and St Peters)[1]
| Party |
Candidate |
Votes |
% |
± |
|
Labour |
A. Roberts |
4,269 |
67.5 |
+4.8 |
|
Conservative |
W. Lackenby |
1,902 |
30.1 |
-3.6 |
|
Communist |
H. Kedward |
154 |
2.4 |
-1.2 |
| Majority |
2,367 |
37.4 |
+8.5 |
| Turnout |
6,325 |
69.7 |
+42.5 |
|
Labour hold |
Swing |
+4.2 |
|
Ward 12 (Golborne Heath Park and Ashton)[1]
| Party |
Candidate |
Votes |
% |
± |
|
Labour |
A. Miller |
4,540 |
64.5 |
-0.4 |
|
Conservative |
J. Harrison |
2,503 |
35.5 |
+0.4 |
| Majority |
2,037 |
28.9 |
-0.8 |
| Turnout |
7,043 |
78.8 |
+42.1 |
|
Labour hold |
Swing |
-0.4 |
|
Ward 14 (Ashton-in-Makerfield Central and East)[1]
| Party |
Candidate |
Votes |
% |
± |
|
Labour |
R. McEntegart |
3,815 |
55.1 |
-1.6 |
|
Conservative |
S. Hibbert |
3,110 |
44.9 |
+1.6 |
| Majority |
705 |
10.2 |
-3.2 |
| Turnout |
6,925 |
75.0 |
+42.5 |
|
Labour gain from Liberal |
Swing |
-1.6 |
|
Ward 24 (Tyldesley - Astley Green and Blackmoor)[1]
| Party |
Candidate |
Votes |
% |
± |
|
Labour |
F. Hampson |
3,220 |
50.8 |
+1.8 |
|
Conservative |
H. Davies |
3,114 |
49.2 |
-1.8 |
| Majority |
106 |
1.7 |
-0.3 |
| Turnout |
6,334 |
80.4 |
+39.0 |
|
Labour hold |
Swing |
+1.8 |
|
References
|
|---|
|
| Metropolitan boroughs | |
|---|
|
| District councils (England) | |
|---|
|
| District councils (Wales) |
- Aberconwy
- Afan
- Alyn and Deeside
- Anglesey - Ynys Môn
- Arfon
- Blaenau Gwent
- Brecknock
- Cardiff
- Carmarthen
- Ceredigion
- Colwyn
- Cynon Valley
- Delyn
- Dinefwr
- Dwyfor
- Glyndŵr
- Islwyn
- Llanelli
- Lliw Valley
- Meirionnydd
- Merthyr Tydfil
- Monmouth
- Montgomery
- Neath
- Newport
- Ogwr
- Preseli
- Radnor
- Rhondda
- Rhuddlan
- Rhymney Valley
- South Pembrokeshire
- Swansea
- Taff-Ely
- Torfaen
- Vale of Glamorgan
- Wrexham Maelor
|
|---|
|
| Referendums | |
|---|
|
|