Wigan Metropolitan Borough Council election, 1978
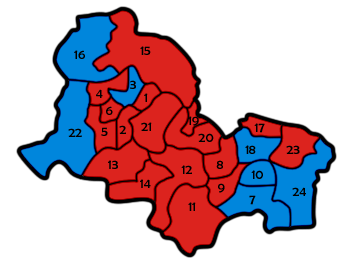
Map of the results for the 1978 Wigan council election.
Labour in red and
Conservatives in blue.
Elections to Wigan Council were held on 4 May 1978, with one third of the council up for election as well as vacancies in Ward 2 and 17. Previous to the election, a Labour councillor in Ward 9 defected to become an Independent Labour, reducing Labour's majority to 38. This seat was up for vote and became the only Labour gain of the night, as they suffered five losses to the Conservatives, and their majority reduced to 30 - half of what it was in 1973. The election seen a first of all wards being contested, with turnout rising marginally to 34.7%.[1]
Election result
| Wigan Local Election Result 1978 |
| Party |
Seats |
Gains |
Losses |
Net gain/loss |
Seats % |
Votes % |
Votes |
+/− |
| |
Labour |
19 |
1 |
5 |
-4 |
73.1 |
54.3 |
42,687 |
+3.0% |
| |
Conservative |
7 |
5 |
0 |
+5 |
26.9 |
43.6 |
34,337 |
+2.8% |
| |
Liberal |
0 |
0 |
0 |
0 |
0.0 |
1.7 |
1,331 |
-2.2% |
| |
Communist |
0 |
0 |
0 |
0 |
0.0 |
0.2 |
147 |
-0.2% |
| |
Independent Labour |
0 |
0 |
1 |
-1 |
0.0 |
0.2 |
146 |
+0.2% |
This result had the following consequences for the total number of seats on the Council after the elections:
| Party |
Previous council |
New council |
|
Labour |
55 |
51 |
|
Conservatives |
14 |
19 |
|
Liberals |
1 |
1 |
|
Independent |
1 |
1 |
|
Independent Labour |
1 |
0 |
| Total |
72 |
72 |
| Working majority |
38 |
30 |
Ward results
Ward 4 (Beech Hill and Marsh Green)[1]
| Party |
Candidate |
Votes |
% |
± |
|
Labour |
E. Naylor |
1,892 |
68.5 |
N/A |
|
Conservative |
A. Atherton |
869 |
31.5 |
N/A |
| Majority |
1,023 |
37.1 |
N/A |
| Turnout |
2,761 |
29.4 |
N/A |
|
Labour hold |
Swing |
N/A |
|
Ward 5 (Highfield and Lamberhead)[1]
| Party |
Candidate |
Votes |
% |
± |
|
Labour |
G. Barlow |
1,553 |
52.4 |
-1.0 |
|
Conservative |
A. Foster |
1,412 |
47.6 |
+1.0 |
| Majority |
141 |
4.8 |
-2.0 |
| Turnout |
2,965 |
26.1 |
-0.3 |
|
Labour hold |
Swing |
-1.0 |
|
Ward 6 (Newtown and Rose Hill)[1]
| Party |
Candidate |
Votes |
% |
± |
|
Labour |
A. Peet |
1,591 |
66.5 |
+4.5 |
|
Conservative |
J. Lawson |
801 |
33.5 |
+5.5 |
| Majority |
790 |
33.0 |
-0.9 |
| Turnout |
2,392 |
27.6 |
+0.2 |
|
Labour hold |
Swing |
-0.5 |
|
Ward 12 (Golborne Heath Park and Ashton)[1]
| Party |
Candidate |
Votes |
% |
± |
|
Labour |
J. Hilton |
2,116 |
64.9 |
-5.4 |
|
Conservative |
J. Harrison |
1,146 |
35.1 |
+5.4 |
| Majority |
970 |
29.7 |
-10.7 |
| Turnout |
3,262 |
36.7 |
-1.2 |
|
Labour hold |
Swing |
-5.4 |
|
Ward 14 (Ashton-in-Makerfield Central and East)[1]
| Party |
Candidate |
Votes |
% |
± |
|
Labour |
S. Lea |
1,645 |
56.7 |
+4.2 |
|
Conservative |
M. Ball |
1,257 |
43.3 |
+14.3 |
| Majority |
388 |
13.4 |
-10.1 |
| Turnout |
2,902 |
32.5 |
-5.4 |
|
Labour hold |
Swing |
-5.0 |
|
Ward 20 (Hindley South East and West)[1]
| Party |
Candidate |
Votes |
% |
± |
|
Labour |
G. Harrison |
1,720 |
55.8 |
+6.0 |
|
Conservative |
T. Whitfield |
1,361 |
44.2 |
+5.2 |
| Majority |
359 |
11.7 |
+0.8 |
| Turnout |
3,081 |
28.3 |
-1.7 |
|
Labour hold |
Swing |
+0.4 |
|
References
|
|---|
|
| London boroughs | |
|---|
|
Metropolitan
boroughs | |
|---|
|
District councils
(England) |
- Basingstoke and Deane
- Bath
- Brentwood
- Broxbourne
- Burnley
- Cambridge
- Cannock Chase
- Chorley
- Colchester
- Congleton
- Eastbourne
- Eastleigh
- Ellesmere Port and Neston
- Elmbridge
- Fareham
- Halton
- Harlow
- Hart
- Hartlepool
- Havant
- Hertsmere
- Huntingdon
- Milton Keynes
- Mole Valley
- Pendle
- Peterborough
- Preston
- Rochford
- Rossendale
- Runnymede
- Shrewsbury and Atcham
- South Bedfordshire
- South Cambridgeshire
- Southend-on-Sea
- Tamworth
- Tandridge
- Thamesdown
- Three Rivers
- Tunbridge Wells
- Watford
- Welwyn Hatfield
- West Lancashire
- Winchester
- Woking
|
|---|
|
Regional councils
(Scotland) | |
|---|