Birmingham City Council election, 2016
| | |||||||||||||||||||||||||||||||||||||||
| |||||||||||||||||||||||||||||||||||||||
| |||||||||||||||||||||||||||||||||||||||
| |||||||||||||||||||||||||||||||||||||||
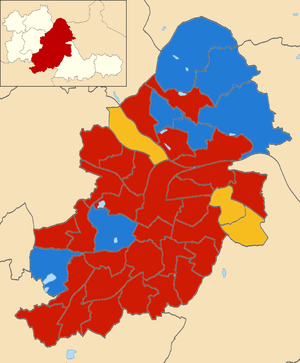
2016 local election results in Birmingham
The 2016 Birmingham City Council election took place on 5 May 2016[1][2][3] to elect one third of the members of Birmingham City Council in England. The election was held on the same day as the election of a Police and Crime Commissioner for the West Midlands as part of the 2016 Police and Crime Commissioner elections.
Labour increased their hold on the City Council, winning 30 of the 40 seats up for election, gaining 1 from the Conservatives and 1 from the Liberal Democrats as well as retaining 1 previously vacant seat formerly held by a Labour Councillor.
Result
| Birmingham City Council election result, 2016 | ||||||||||
|---|---|---|---|---|---|---|---|---|---|---|
| Party | Seats | Gains | Losses | Net gain/loss | Seats % | Votes % | Votes | +/− | ||
| Labour | 30 | +2 | +2 | 75% | 51.09% | 113,018 | +3,177 | |||
| Conservative | 7 | -1 | -1 | 17.5% | 22.98% | 50,828 | –662 | |||
| Liberal Democrat | 3 | -1 | -1 | 7.5% | 12.15% | 26,877 | –7,830 | |||
| UKIP | 0 | 0 | 0 | 8.05% | 17,801 | +12,886 | ||||
| Green | 0 | 0 | 0 | 4.48% | 9,920 | +217 | ||||
| Independent | 0 | 0 | 0 | 0.45% | 989 | +844 | ||||
| TUSC | 0 | 0 | 0 | 0.42% | 937 | +879 | ||||
| Socialist Labour | 0 | 0 | 0 | 0.16% | 358 | –71 | ||||
| Christian | 0 | 0 | 0 | 0.14% | 310 | +132 | ||||
| National Front | 0 | 0 | 0 | 0.05% | 104 | –39 | ||||
| Social Democratic | 0 | 0 | 0 | 0.03% | 58 | –4 | ||||
| Totals | 40 | 221,200 | ||||||||
Council Composition
Prior to the election, the composition of the council was:
| 77 | 30 | 11 | 1 | 1 |
| Labour | Conservative | Lib Dem |
Ind | Vac |
After the election, the composition of the council was:
| 80 | 29 | 10 | 1 |
| Labour | Conservative | Lib Dem | Ind |
- Lib Dem - Liberal Democrats
- Ind - Independent
Ward results
Acocks Green
| Party | Candidate | Votes | % | ± | |
|---|---|---|---|---|---|
| Labour | John O'Shea | 2,760 | 47.99 | +5.29 | |
| Liberal Democrat | Penny Wagg | 2,136 | 37.14 | -2.06 | |
| Conservative | Richard Sparkes | 467 | 8.12 | -3.22 | |
| Green | Amanda Baker | 225 | 3.91 | +0.61 | |
| TUSC | Eamonn Flynn | 131 | 2.28 | +1.18 | |
| Social Democratic | Alan Ware | 32 | 0.56 | +0.26 | |
| Majority | 624 | 10.85 | +7.37 | ||
| Turnout | 5,751 | 30.42 | |||
| Labour hold | Swing | +3.66 | |||
Aston
| Party | Candidate | Votes | % | ± | |
|---|---|---|---|---|---|
| Labour | Nagina Kauser | 5,047 | 88.62 | +38.12 | |
| Conservative | Jahid Choudhury | 208 | 3.65 | +1.65 | |
| Green | Christopher Garghan | 181 | 3.18 | +1.88 | |
| Christian | Adrian Dawkins | 159 | 2.79 | - | |
| Liberal Democrat | Yaser Iqbal | 100 | 1.76 | -42.44 | |
| Majority | 4,839 | 84.97 | +78.69 | ||
| Turnout | 5,695 | 32.24 | |||
| Labour hold | Swing | +18.24 | |||
Bartley Green
| Party | Candidate | Votes | % | ± | |
|---|---|---|---|---|---|
| Conservative | Des Flood | 2,080 | 45.0 | -1.5 | |
| Labour | Saddak Miah | 1,270 | 27.5 | -3.7 | |
| UKIP | Tony Hayes | 827 | 17.9 | +1.8 | |
| Green | Peter Thorneycroft | 216 | 4.7 | -0.9 | |
| Liberal Democrat | Julia Garrett | 165 | 3.6 | +1.4 | |
| TUSC | Moira O'Driscoll | 62 | 1.3 | ||
| Majority | 810 | 17.5 | |||
| Turnout | 4,620 | 27.3 | |||
| Conservative hold | Swing | ||||
Billesley
| Party | Candidate | Votes | % | ± | |
|---|---|---|---|---|---|
| Labour | Phil Davis | 2,730 | 52.2 | ||
| UKIP | James Dalton | 1,052 | 20.1 | ||
| Conservative | Aaron Humphriss | 1,045 | 20.0 | ||
| Green | Clare Thomas | 218 | 4.2 | ||
| Liberal Democrat | Alan Morrow | 187 | 3.6 | ||
| Majority | 1,678 | 32.1 | |||
| Turnout | 5,232 | 28.4 | |||
| Labour hold | Swing | ||||
Bordesley Green
| Party | Candidate | Votes | % | ± | |
|---|---|---|---|---|---|
| Labour | Uzma Ahmed | 4,300 | 58.3 | -16.9 | |
| Liberal Democrat | Shaukat Khan | 2,298 | 31.2 | -17.1 | |
| UKIP | Mohammed Khan | 337 | 4.6 | +4.6 | |
| Green | Alan Clawley | 242 | 3.3 | -1.7 | |
| Conservative | Guy Hordern | 198 | 2.7 | -2.3 | |
| Majority | 2,002 | 27.1 | |||
| Turnout | 7,375 | 37.2 | |||
| Labour hold | Swing | ||||
Bournville
| Party | Candidate | Votes | % | ± | |
|---|---|---|---|---|---|
| Labour | Mary Locke | 3,408 | 42.9 | +6.4 | |
| Conservative | Nigel Dawkins | 3,095 | 38.9 | -1.9 | |
| Green | Ian Jamieson | 695 | 8.7 | -1.1 | |
| UKIP | Sylvia Tempest-Jones | 514 | 6.5 | -2.4 | |
| Liberal Democrat | Robert Gilliam | 196 | 2.4 | -1.6 | |
| Majority | 313 | 3.9 | |||
| Turnout | 7,948 | 42.3 | |||
| Labour hold | Swing | +4.2 | |||
Brandwood
| Party | Candidate | Votes | % | ± | |
|---|---|---|---|---|---|
| Labour | Eva Phillips | 3,520 | 56.1 | +9.8 | |
| Conservative | Neville Summerfield | 1,485 | 23.7 | -5.4 | |
| UKIP | Alan Blumenthal | 813 | 13.0 | -1.6 | |
| Green | Patrick Cox | 266 | 4.2 | -1.6 | |
| Liberal Democrat | Richard Smith | 186 | 3.0 | -1.2 | |
| Majority | 2,035 | 32.4 | |||
| Turnout | 6,270 | 35.1 | |||
| Labour hold | Swing | ||||
Edgbaston
| Party | Candidate | Votes | % | ± | |
|---|---|---|---|---|---|
| Conservative | Deirdre Alden | 2,043 | 44.6 | +2.1 | |
| Labour | Tom Keeley | 1,967 | 42.9 | +2.3 | |
| Green | Joe Belcher | 222 | 4.8 | -3.2 | |
| UKIP | Peter Hughes | 180 | 3.9 | -0.5 | |
| Liberal Democrat | Lee Dargue | 174 | 3.8 | -0.7 | |
| Majority | 76 | 1.7 | |||
| Turnout | 4,586 | 32.3 | |||
| Conservative hold | Swing | ||||
Erdington
| Party | Candidate | Votes | % | ± | |
|---|---|---|---|---|---|
| Conservative | Bob Beauchamp | 2,722 | 53.0 | +9.7 | |
| Labour | Keith Heron | 1,701 | 33.1 | -2.9 | |
| UKIP | Steve Cooling | 462 | 9.0 | -3.8 | |
| Green | Joe Rooney | 122 | 2.4 | -1.0 | |
| Liberal Democrat | Philip Mills | 103 | 2.0 | -0.6 | |
| TUSC | Joe Foster | 30 | 0.6 | -0.3 | |
| Majority | 1,021 | 19.9 | |||
| Turnout | 5,140 | 31.9 | |||
| Conservative hold | Swing | ||||
Hall Green
| Party | Candidate | Votes | % | ± | |
|---|---|---|---|---|---|
| Labour | Barry Bowles | 2,827 | 42.2 | +1.8 | |
| Conservative | Tom Skidmore | 1,823 | 27.2 | +3.6 | |
| Independent | Bob Harvey | 989 | 14.8 | +6.7 | |
| Liberal Democrat | Tavneer Choudhry | 467 | 7.0 | -9.4 | |
| UKIP | Malcolm Mummery | 400 | 6.1 | -1.8 | |
| Green | Rachel Xerri-Brooks | 162 | 2.4 | -0.8 | |
| TUSC | David Wright | 20 | 0.3 | -0.1 | |
| Majority | 1,004 | 5.9 | |||
| Turnout | 18,998 | ||||
| Labour hold | Swing | ||||
Handsworth Wood
| Party | Candidate | Votes | % | ± | |
|---|---|---|---|---|---|
| Labour | Gurdial Atwal | 3,743 | 66.8 | +2.9 | |
| Conservative | Sukhwinder Sungu | 863 | 15.4 | +7.1 | |
| Green | Chloe Juliette | 370 | 6.6 | +2.5 | |
| Socialist Labour | John Tyrrell | 358 | 6.4 | +4.8 | |
| Liberal Democrat | Valvinder Kaur | 267 | 4.8 | +1.3 | |
| Majority | 2,880 | 51.4 | |||
| Turnout | 5,601 | 30.7 | |||
| Labour hold | Swing | ||||
Harborne
| Party | Candidate | Votes | % | ± | |
|---|---|---|---|---|---|
| Labour | Jayne Francis | 2,841 | 44.7 | +1.7 | |
| Conservative | Akaal Sidhu | 2,404 | 37.8 | -0.5 | |
| Green | Phil Simpson | 494 | 7.8 | -0.6 | |
| UKIP | Mary Morris | 376 | 5.9 | +0.2 | |
| Liberal Democrat | Philip Banting | 240 | 3.8 | -0.8 | |
| Majority | 437 | 6.9 | +2.2 | ||
| Turnout | 6,355 | 39.2 | |||
| Labour hold | Swing | ||||
Hodge Hill
| Party | Candidate | Votes | % | ± | |
|---|---|---|---|---|---|
| Labour | Diane Donaldson | 3,433 | 66.0 | +5.0 | |
| UKIP | David Bridges | 680 | 13.1 | -2.2 | |
| Liberal Democrat | Gwyn Neilly | 542 | 10.4 | +6.6 | |
| Conservative | Parveen Hassan | 405 | 7.8 | -8.7 | |
| Green | Michael Harrison | 114 | 2.2 | -0.5 | |
| Social Democratic | Peter Johnson | 26 | 0.5 | +0.5 | |
| Majority | 2,753 | 52.9 | +8.4 | ||
| Turnout | 5,200 | 29.8 | |||
| Labour hold | Swing | ||||
Kings Norton
| Party | Candidate | Votes | % | ± | |
|---|---|---|---|---|---|
| Labour | Valerie Seabright | 1,834 | 38.7 | -0.5 | |
| Conservative | Barbara Wood | 1,811 | 38.3 | +0.3 | |
| UKIP | Tim Plumbe | 722 | 15.3 | -0.4 | |
| Liberal Democrat | Peter Lloyd | 196 | 4.1 | +1.2 | |
| Green | Eleanor Masters | 172 | 3.6 | -0.6 | |
| Majority | 23 | 0.5 | -0.7 | ||
| Turnout | 4,735 | 29.3 | |||
| Labour hold | Swing | ||||
Kingstanding
| Party | Candidate | Votes | % | ± | |
|---|---|---|---|---|---|
| Conservative | Gary Sambrook | 1,858 | 43.5 | +11.8 | |
| Labour | Jane Jones | 1,651 | 38.6 | -3.9 | |
| UKIP | Philip Davies | 593 | 13.9 | -7.2 | |
| Green | Anne Okole | 89 | 2.1 | -0.3 | |
| Liberal Democrat | Graham Lippiatt | 48 | 1.1 | -0.5 | |
| National Front | Terry Williams | 21 | 0.5 | +0.5 | |
| TUSC | Joseph Derbyshire | 16 | 0.4 | -0.3 | |
| Majority | 207 | 4.8 | -6.0 | ||
| Turnout | 4,276 | 26.1 | |||
| Conservative hold | Swing | ||||
Ladywood
| Party | Candidate | Votes | % | ± | |
|---|---|---|---|---|---|
| Labour | Kath Hartley | 2,337 | 62.7 | +10.7 | |
| Conservative | Rob Coleman | 735 | 19.7 | -5.3 | |
| Green | Sara Myers | 372 | 10.0 | -0.9 | |
| Liberal Democrat | Gareth Hardy | 284 | 7.6 | +1.8 | |
| Majority | 1,602 | 43.0 | +16.0 | ||
| Turnout | 3,728 | 22.0 | |||
| Labour hold | Swing | ||||
Longbridge
| Party | Candidate | Votes | % | ± | |
|---|---|---|---|---|---|
| Labour | Carole Griffiths | 1,753 | 39.74 | ||
| Conservative | Dan Caldicott | 1,316 | 29.83 | ||
| UKIP | Kevin Morris | 993 | 22.51 | ||
| Green | Elizabeth Sharman | 152 | 3.45 | ||
| Liberal Democrat | Kevin Hannon | 147 | 3.33 | ||
| TUSC | Clive Walder | 50 | 1.13 | ||
| Majority | 437 | 9.91 | |||
| Turnout | 4,411 | ||||
| Labour hold | Swing | ||||
Lozells and East Handsworth
| Party | Candidate | Votes | % | ± | |
|---|---|---|---|---|---|
| Labour | Mahmood Hussain | 4,967 | |||
| Conservative | Ravi Chumber | 448 | |||
| Green | Hazel Clawley | 295 | |||
| Liberal Democrat | Baljinder Kaur | 250 | |||
| Majority | 4,519 | ||||
| Turnout | |||||
| Labour hold | Swing | ||||
Moseley and Kings Heath
| Party | Candidate | Votes | % | ± | |
|---|---|---|---|---|---|
| Labour | Lisa Trickett | 4,029 | |||
| Liberal Democrat | Martin Mullaney | 1,945 | |||
| Green | Robert Grant | 554 | |||
| Conservative | Owen Williams | 522 | |||
| UKIP | Kenneth Lowry | 231 | |||
| Majority | 2,084 | ||||
| Turnout | |||||
| Labour hold | Swing | ||||
Nechells
| Party | Candidate | Votes | % | ± | |
|---|---|---|---|---|---|
| Labour | Tahir Ali | 3,405 | |||
| Conservative | Emma Watkins | 414 | |||
| Green | Janet Assheton | 295 | |||
| Liberal Democrat | Nicholas Jolliffe | 174 | |||
| Majority | 2,991 | ||||
| Turnout | |||||
| Labour hold | Swing | ||||
Northfield
| Party | Candidate | Votes | % | ± | |
|---|---|---|---|---|---|
| Labour | Brett O'Reilly | 2,283 | 38.93 | ||
| Conservative | Les Lawrence | 2,098 | 35.78 | ||
| UKIP | Keith Rowe | 752 | 12.82 | ||
| Green | Fiona Nunan | 575 | 9.81 | ||
| Liberal Democrat | Andy Moles | 156 | 2.66 | ||
| Majority | 185 | 3.15 | |||
| Turnout | 5,864 | ||||
| Labour hold | Swing | ||||
Oscott
| Party | Candidate | Votes | % | ± | |
|---|---|---|---|---|---|
| Labour | Tristan Chatfield | 2,042 | |||
| Conservative | Graham Green | 1,100 | |||
| UKIP | Roger Tempest | 926 | |||
| Liberal Democrat | Andrew Fullylove | 164 | |||
| Green | Harry Eyles | 108 | |||
| National Front | Adrian Davidson | 37 | |||
| Majority | 942 | ||||
| Turnout | |||||
| Labour hold | Swing | ||||
Perry Barr
| Party | Candidate | Votes | % | ± | |
|---|---|---|---|---|---|
| Liberal Democrat | Ray Hassall | 3,248 | |||
| Labour | Mohammed Hanif | 2,085 | |||
| Conservative | Alain Hurst | 338 | |||
| Green | Beck Collins | 200 | |||
| Majority | 1,163 | ||||
| Turnout | |||||
| Liberal Democrat hold | Swing | ||||
Quinton
| Party | Candidate | Votes | % | ± | |
|---|---|---|---|---|---|
| Labour | Kate Booth | 2,668 | 45.89 | ||
| Conservative | Georgina Chandler | 2,067 | 35.55 | ||
| UKIP | Martin Barrett | 641 | 11.03 | ||
| Green | James Robertson | 225 | 3.87 | ||
| Liberal Democrat | Ian Garrett | 185 | 3.18 | ||
| TUSC | Nick Hart | 28 | 0.48 | ||
| Majority | 601 | 10.34 | |||
| Turnout | 5,814 | ||||
| Labour hold | Swing | ||||
Selly Oak
| Party | Candidate | Votes | % | ± | |
|---|---|---|---|---|---|
| Labour | Karen McCarthy | 2,141 | 51.5 | +6 | |
| Conservative | Monica Hardie | 779 | 18.7 | -4 | |
| Liberal Democrat | Colin Green | 763 | 18.4 | +3.2 | |
| Green | Daniel Wilshire | 381 | 9 | -3.2 | |
| TUSC | Theo Sharieff | 67 | 1.6 | -0.4 | |
| Majority | 1,362 | 32.8 | +13 | ||
| Turnout | 1,462 | ||||
| Labour hold | Swing | +5 | |||
Shard End
| Party | Candidate | Votes | % | ± | |
|---|---|---|---|---|---|
| Labour | Marjorie Birdle | 2,437 | |||
| UKIP | Paul Clayton | 1,178 | |||
| Conservative | Nick Psirides | 284 | |||
| Green | Sam Braithwaite | 106 | |||
| Liberal Democrat | Christopher Barber | 104 | |||
| Majority | 1,259 | ||||
| Turnout | |||||
| Labour hold | Swing | ||||
Sheldon
| Party | Candidate | Votes | % | ± | |
|---|---|---|---|---|---|
| Liberal Democrat | Sue Anderson | 2,742 | 58.41 | ||
| Labour | Bob Collins | 928 | 19.77 | ||
| UKIP | Attiqa Khan | 486 | 10.35 | ||
| Conservative | Alexander Hall | 314 | 6.69 | ||
| Green | Max Ramsay | 142 | 3.03 | ||
| National Front | Paul Morris | 46 | 0.98 | ||
| TUSC | Richard Carter | 36 | 0.77 | ||
| Majority | 1,814 | 38.65 | |||
| Turnout | 4,694 | ||||
| Liberal Democrat hold | Swing | ||||
Soho
| Party | Candidate | Votes | % | ± | |
|---|---|---|---|---|---|
| Labour | Chaman Lal | 4,263 | |||
| Conservative | Robert Higginson | 440 | |||
| Green | Kefentse Dennis | 262 | |||
| Liberal Democrat | Morriam Jan | 193 | |||
| Christian | Pastor Gabriel Ukandu | 151 | |||
| Majority | 3,823 | ||||
| Turnout | |||||
| Labour hold | Swing | ||||
South Yardley
| Party | Candidate | Votes | % | ± | |
|---|---|---|---|---|---|
| Labour | Zafar Iqbal | 3,112 | |||
| Liberal Democrat | Baber Baz | 2,361 | |||
| Conservative | Neil Shastri-Hurst | 408 | |||
| TUSC | Mark Andrews | 372 | |||
| Green | Ulla Grant | 207 | |||
| Majority | 751 | ||||
| Turnout | |||||
| Labour hold | Swing | ||||
Sparkbrook
| Party | Candidate | Votes | % | ± | |
|---|---|---|---|---|---|
| Labour | Mohammed Azim | 6,069 | 87.61 | ||
| Conservative | Santhi Rajakaruna | 343 | 4.95 | ||
| Green | Elly Stanton | 307 | 4.43 | ||
| Liberal Democrat | Blair Kesseler | 208 | 3.00 | ||
| Majority | 5,726 | 82.66 | |||
| Turnout | 6,927 | ||||
| Labour hold | Swing | ||||
Springfield
| Party | Candidate | Votes | % | ± | |
|---|---|---|---|---|---|
| Labour | Shabrana Hussain | 3,828 | 47.44 | ||
| Liberal Democrat | Jerry Evans | 3,775 | 46.78 | ||
| Conservative | Adam Higgs | 292 | 3.62 | ||
| Green | Seeyam Brijmohun | 174 | 2.16 | ||
| Majority | 53 | 0.66 | |||
| Turnout | 8,069 | ||||
| Labour gain from Liberal Democrat | Swing | ||||
Stechford and Yardley North
| Party | Candidate | Votes | % | ± | |
|---|---|---|---|---|---|
| Liberal Democrat | Neil Eustace | 3,001 | |||
| Labour | Cheryl Garvey | 1,721 | |||
| UKIP | Graham Duffen | 580 | |||
| Conservative | Mary Storer | 193 | |||
| Green | Julien Pritchard | 70 | |||
| Majority | 1,280 | ||||
| Turnout | |||||
| Liberal Democrat hold | Swing | ||||
Stockland Green
| Party | Candidate | Votes | % | ± | |
|---|---|---|---|---|---|
| Labour | Josh Jones | 2,533 | |||
| Conservative | Leona Leung | 698 | |||
| UKIP | Albert Meehan | 535 | |||
| Liberal Democrat | Franklyn Aaron | 189 | |||
| Green | Darren Smith | 133 | |||
| TUSC | Ted Woodley | 71 | |||
| Majority | 1,835 | ||||
| Turnout | |||||
| Labour hold | Swing | ||||
Sutton Four Oaks
| Party | Candidate | Votes | % | ± | |
|---|---|---|---|---|---|
| Conservative | Meirion Jenkins | 4,022 | 61.67 | ||
| Labour | Peter French | 970 | 14.87 | ||
| UKIP | Stephen Shorrock | 845 | 12.96 | ||
| Liberal Democrat | Hubert Duffy | 354 | 5.43 | ||
| Green | David Ratcliff | 331 | 5.08 | ||
| Majority | 3,052 | 46.80 | |||
| Turnout | 6,522 | ||||
| Conservative hold | Swing | ||||
Sutton New Hall
| Party | Candidate | Votes | % | ± | |
|---|---|---|---|---|---|
| Conservative | Alex Yip | 3,277 | |||
| Labour | Ian Brindley | 1,007 | |||
| UKIP | Stewart Cotterill | 856 | |||
| Green | Colin Marriott | 231 | |||
| Liberal Democrat | Trevor Holtom | 211 | |||
| Majority | 2,270 | ||||
| Turnout | |||||
| Conservative hold | Swing | ||||
Sutton Trinity
| Party | Candidate | Votes | % | ± | |
|---|---|---|---|---|---|
| Conservative | Margaret Waddington | 2,890 | |||
| Labour | Roger Barley | 1,265 | |||
| UKIP | Michael Joyce | 879 | |||
| Liberal Democrat | Jennifer Wilkinson | 360 | |||
| Green | Eloise England | 309 | |||
| Majority | 1,625 | ||||
| Turnout | |||||
| Conservative hold | Swing | ||||
Sutton Vesey
| Party | Candidate | Votes | % | ± | |
|---|---|---|---|---|---|
| Labour | Rob Pocock | 4,102 | |||
| Conservative | Suzanne Webb | 2,303 | |||
| UKIP | Maureen Smith | 457 | |||
| Green | Zoe Challenor | 163 | |||
| Liberal Democrat | Sally Lippiatt | 163 | |||
| Majority | 1,799 | ||||
| Turnout | |||||
| Labour hold | Swing | ||||
Tyburn
| Party | Candidate | Votes | % | ± | |
|---|---|---|---|---|---|
| Labour | Mick Brown | 1,780 | |||
| UKIP | Andrew Garcarz | 747 | |||
| Conservative | Clifton Welch | 747 | |||
| Liberal Democrat | Ann Holtom | 318 | |||
| Green | Giovanni Esposito | 86 | |||
| TUSC | Marie O'Connor | 54 | |||
| Majority | 1,033 | ||||
| Turnout | |||||
| Labour hold | Swing | ||||
Washwood Heath
| Party | Candidate | Votes | % | ± | |
|---|---|---|---|---|---|
| Labour | Mariam Khan | 6,136 | 81.15 | ||
| Liberal Democrat | Shamsur Rehman | 821 | 10.86 | ||
| Conservative | Adrian Delaney | 350 | 4.63 | ||
| Green | Jane McKears | 254 | 3.36 | ||
| Majority | 5,315 | 70.29 | |||
| Turnout | 7,561 | ||||
| Labour hold | Swing | ||||
Weoley
| Party | Candidate | Votes | % | ± | |
|---|---|---|---|---|---|
| Labour | Julie Johnson | 2,125 | 40.71 | ||
| Conservative | Eddie Freeman | 1,943 | 37.22 | ||
| UKIP | Steven Brookes | 739 | 14.16 | ||
| Liberal Democrat | Steve Haynes | 213 | 4.08 | ||
| Green | Ben Kerr-Morgan | 200 | 3.83 | ||
| Majority | 182 | 3.49 | |||
| Turnout | 5,220 | ||||
| Labour gain from Conservative | Swing | ||||
References
- ↑ "Election Timetable in England" (PDF). gov.uk. Retrieved 23 September 2015.
- ↑ "Upcoming elections & referendums". Electoral Commission. Retrieved 23 September 2015.
- ↑ "City Council elections information". Birmingham City Council. Retrieved 22 April 2016.
This article is issued from Wikipedia - version of the 8/22/2016. The text is available under the Creative Commons Attribution/Share Alike but additional terms may apply for the media files.