Leeds City Council election, 2016
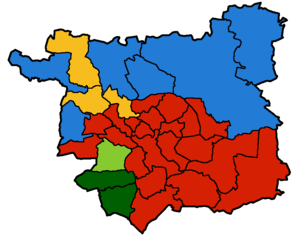
2016 local election results in Leeds
The 2016 Leeds City Council election took place on 5 May 2016 to elect members of Leeds City Council in England.[1] This was on the same day as other local elections. One third of the council was up for election to replace the councillors elected in 2012.
| Leeds City Council Election Result 2016[2] | ||||||||||
|---|---|---|---|---|---|---|---|---|---|---|
| Party | Seats | Gains | Losses | Net gain/loss | Seats % | Votes % | Votes | +/− | ||
| Labour | 21 | 0 | 0 | 0 | 63.6 | 43.0 | 79,442 | +4.4% | ||
| Conservative | 6 | 0 | 0 | 0 | 18.2 | 23.0 | 42,465 | +1.5% | ||
| UKIP | 0 | 0 | 0 | 0 | 0 | 12.5 | 23,166 | -4.2% | ||
| Green | 1 | 0 | 0 | 0 | 3.0 | 7.1 | 13,021 | -2.0% | ||
| Liberal Democrat | 3 | 0 | 0 | 0 | 9.1 | 10.0 | 18,525 | -0.2% | ||
| Morley Borough Independent | 2 | 0 | 0 | 0 | 6.1 | 2.8 | 5,079 | +0.3% | ||
| TUSC | 0 | 0 | 0 | 0 | 0 | 0.2 | 387 | -0.1% | ||
| Alliance for Green Socialism | 0 | 0 | 0 | 0 | 0 | 0.3 | 541 | -0.3% | ||
| Yorkshire First | 0 | 0 | 0 | 0 | 0 | 0.6 | 1,063 | +0.6% | ||
| Independent | 0 | 0 | 0 | 0 | 0 | 0.5 | 987 | +0.2% | ||
This result had the following consequences for the total number of seats on the council after the elections:[2][3]
| Party | Previous council | New council | |||
|---|---|---|---|---|---|
| Labour | 63 | 63 | |||
| Conservative | 19 | 19 | |||
| Liberal Democrat | 9 | 9 | |||
| Morley Borough Independent | 5 | 5 | |||
| Green | 3 | 3 | |||
| Total | 99 | 99 | |||
| Working majority | 27 | 27 | |||
Ward results
| Party | Candidate | Votes | % | ± | |
|---|---|---|---|---|---|
| Conservative | Barry John Anderson | 4,125 | 58.4 | +12.3 | |
| Labour | Paul Ian Wray | 1,270 | 18.0 | -0.6 | |
| Liberal Democrat | Cheryl Kebede | 948 | 13.4 | -8.4 | |
| UKIP | Glenn Morley | 440 | 6.2 | -1.5 | |
| Green | Emma Louise Carter | 281 | 4.0 | -1.8 | |
| Majority | 2,855 | 40.4 | +16.0 | ||
| Turnout | 7,064 | 45.5 | |||
| Conservative hold | Swing | ||||
| Party | Candidate | Votes | % | ± | |
|---|---|---|---|---|---|
| Conservative | Neil Alan Buckley | 3,443 | 52.1 | +0.7 | |
| Labour | Keith Michael White | 1,982 | 30.0 | -1.0 | |
| UKIP | Warren Hendon | 534 | 8.1 | +0.6 | |
| Liberal Democrat | Roderic Parker | 348 | 5.3 | -0.2 | |
| Green | Miriam Leontine Moss | 223 | 3.4 | +0.3 | |
| Alliance for Green Socialism | Brian Jackson | 83 | 1.3 | +0.5 | |
| Majority | 1,461 | 22.1 | +1.7 | ||
| Turnout | 6,613 | 38.1 | |||
| Conservative hold | Swing | ||||
| Party | Candidate | Votes | % | ± | |
|---|---|---|---|---|---|
| Labour | Karen Renshaw | 2,248 | 46.1 | +6.6 | |
| Conservative | Tim Atkin | 1,161 | 23.8 | -9.1 | |
| UKIP | Lindon Dove | 1,096 | 22.5 | +2.0 | |
| Liberal Democrat | Benjamin Lloyd Ward | 225 | 4.6 | +1.2 | |
| Green | Lyssie Page | 143 | 2.9 | +0.8 | |
| Majority | 1,087 | 22.3 | +15.7 | ||
| Turnout | 4,873 | 28.5 | |||
| Labour hold | Swing | ||||
| Party | Candidate | Votes | % | ± | |
|---|---|---|---|---|---|
| Labour | Alison Natalie Kay Lowe | 2,726 | 55.7 | +7.4 | |
| UKIP | David Caldwell | 1,104 | 22.6 | +1.3 | |
| Green | David Michael Smith | 453 | 9.3 | -2.3 | |
| Conservative | Shane Gary Morgan | 380 | 7.8 | +4.9 | |
| Liberal Democrat | Christine Amy Glover | 181 | 3.7 | -0.3 | |
| TUSC | Beth Sutcliffe | 47 | 1.0 | -0.1 | |
| Majority | 1,622 | 33.1 | +6.2 | ||
| Turnout | 4,891 | 29.1 | |||
| Labour hold | Swing | ||||
| Party | Candidate | Votes | % | ± | |
|---|---|---|---|---|---|
| Labour | Angela Gabriel | 2,547 | 61.4 | +8.3 | |
| UKIP | Luke Barry Senior | 833 | 20.1 | -2.9 | |
| Conservative | Robert James William Winfield | 429 | 10.3 | -3.9 | |
| Green | Adam David John Dent | 232 | 5.6 | -0.3 | |
| Liberal Democrat | Kathryn Elizabeth Gagen | 84 | 2.0 | -0.4 | |
| TUSC | Kevin Michael Pattison | 26 | 0.6 | -0.9 | |
| Majority | 1,714 | +40.3 | +10.2 | ||
| Turnout | 4,151 | 28.3 | |||
| Labour hold | Swing | ||||
| Party | Candidate | Votes | % | ± | |
|---|---|---|---|---|---|
| Labour | Caroline Anne Gruen | 2,370 | 51.2 | +5.4 | |
| UKIP | Anne Murgatroyd | 1,152 | 24.9 | +2.3 | |
| Conservative | Alex Nancolas | 484 | 10.5 | +7.8 | |
| Green | Kate Bisson | 453 | 9.8 | -1.3 | |
| Liberal Democrat | Serena Samantha Glover | 171 | 3.7 | +0.5 | |
| Majority | 1,218 | 26.3 | +3.1 | ||
| Turnout | 4,630 | 29.2 | |||
| Labour hold | Swing | ||||
| Party | Candidate | Votes | % | ± | |
|---|---|---|---|---|---|
| Labour | Denise Ragan | 2,279 | 57.4 | +3.6 | |
| UKIP | Geoff Holloran | 766 | 19.3 | -1.4 | |
| Liberal Democrat | David Ewan Hollingsworth | 464 | 11.7 | +2.3 | |
| Green | Penny Ellen Gilg | 223 | 5.6 | +0.5 | |
| Conservative | Peter Cavendish Lord | 189 | 4.8 | +4.3 | |
| TUSC | James Alan Ellis | 47 | 1.2 | +0.7 | |
| Majority | 1,513 | 38.1 | +5.0 | ||
| Turnout | 3,968 | 27.2 | |||
| Labour hold | Swing | ||||
| Party | Candidate | Votes | % | ± | |
|---|---|---|---|---|---|
| Conservative | Andrew Carter | 3,674 | 52.9 | +5.9 | |
| Labour | Peter Carlill | 2,269 | 32.7 | +3.7 | |
| UKIP | Malcolm Steele | 596 | 8.6 | -0.2 | |
| Liberal Democrat | Kate Arbuckle | 249 | 3.6 | +0.2 | |
| Green | Clive Richard Lord | 161 | 2.3 | +2.1 | |
| Majority | 1,405 | 20.2 | +9.6 | ||
| Turnout | 6,949 | 39.6 | |||
| Conservative hold | Swing | ||||
| Party | Candidate | Votes | % | ± | |
|---|---|---|---|---|---|
| Labour | Eileen Taylor | 4,169 | 69.5 | +11.5 | |
| Conservative | David Bernard Myers | 541 | 9.0 | +6.2 | |
| Green | Keith Mollison | 464 | 7.7 | +6.4 | |
| UKIP | Sheila Valerie Store | 290 | 4.8 | +4.8 | |
| Liberal Democrat | Darren Finlay | 275 | 4.6 | +3.3 | |
| Alliance for Green Socialism | Mike Davies | 262 | 4.4 | -0.6 | |
| Majority | 3,628 | 60.5 | +17.7 | ||
| Turnout | 6,001 | 36.0 | |||
| Labour hold | Swing | ||||
| Party | Candidate | Votes | % | ± | |
|---|---|---|---|---|---|
| Labour | Eizabeth Anne Nash | 2,483 | 49.1 | +4.2 | |
| Green | Ed Carlisle | 1,397 | 27.6 | +4.8 | |
| Conservative | Amy Green | 443 | 8.8 | 10.8 | |
| UKIP | Brian Weatherill | 425 | 8.4 | +1.5 | |
| Liberal Democrat | Jahangir Aziz | 252 | 4.9 | +0 | |
| TUSC | Mary Rosamund Finch | 54 | 1.2 | +1.2 | |
| Majority | 1,086 | 21.5 | -0.5 | ||
| Turnout | 5,054 | 25.9 | |||
| Labour hold | Swing | ||||
| Party | Candidate | Votes | % | ± | |
|---|---|---|---|---|---|
| Labour | Janette Walker | 2,789 | 48.6 | +2.8 | |
| UKIP | Mark Stephen Maniatt | 1,446 | 25.2 | +3.6 | |
| Conservative | Matthew Raymond Gale | 1,088 | 18.8 | -5.6 | |
| Liberal Democrat | Kate Elizabeth Langwick | 245 | 4.3 | +0.6 | |
| Green | Florence Scott | 165 | 3.1 | -1.4 | |
| Majority | 1,343 | 23.4 | +2.0 | ||
| Turnout | 5,733 | 32.4 | |||
| Labour hold | Swing | ||||
| Party | Candidate | Votes | % | ± | |
|---|---|---|---|---|---|
| Green | David Blackburn | 2,517 | 47.6 | +10.8 | |
| Labour | John Hamilton Hardy | 1,576 | 29.8 | -0.8 | |
| UKIP | Tony Roberts | 751 | 14.2 | -4.8 | |
| Conservative | Hayley Laura Nancolas | 380 | 7.2 | -3.8 | |
| Liberal Democrat | Rob Jacques | 60 | 1.2 | -0.8 | |
| Majority | 941 | 17.8 | +11.7 | ||
| Turnout | 5,284 | 30.4 | |||
| Green hold | Swing | ||||
| Party | Candidate | Votes | % | ± | |
|---|---|---|---|---|---|
| Labour | Sarah Jane Field | 3,582 | 55.2 | -2.0 | |
| Conservative | Daniel Peter Farrell | 1,726 | 26.6 | -0.1 | |
| UKIP | Terry Harkin | 862 | 13.3 | +2.3 | |
| Green | Kieran White | 175 | 2.7 | -0.1 | |
| Liberal Democrat | Mitchell Galdas | 147 | 2.3 | +0 | |
| Majority | 1,856 | 28.6 | -4.0 | ||
| Turnout | 6,492 | 40.6 | |||
| Labour hold | Swing | ||||
| Party | Candidate | Votes | % | ± | |
|---|---|---|---|---|---|
| Labour | Salma Arif | 3,972 | 79.0 | +5.1 | |
| UKIP | Khalil Mohammed Kungulilo | 360 | 7.2 | -3.6 | |
| Conservative | Beatrice Greenwood | 263 | 5.2 | -1.4 | |
| Liberal Democrat | Margaret Sandra Tait | 245 | 4.9 | +0.0 | |
| Green | Rhian Margaret Williams | 130 | 2.6 | -1.2 | |
| TUSC | Tanis Izabelle Belsham-Wray | 60 | 1.2 | +1.2 | |
| Majority | 3,612 | 71.8 | +8.7 | ||
| Turnout | 5,030 | 32.6 | |||
| Labour hold | Swing | ||||
| Party | Candidate | Votes | % | ± | |
|---|---|---|---|---|---|
| Conservative | Graham Naylor Latty | 3,177 | 44.0 | -2.6 | |
| Labour | David Robert Bowe | 2,114 | 29.3 | -2.0 | |
| Yorkshire First | Bob Buxton | 741 | 10.3 | +10.3 | |
| UKIP | Lynn Christine Parker | 571 | 7.9 | 3.3 | |
| Liberal Democrat | Simon Mark Dowling | 367 | 5.1 | -3.9 | |
| Green | Lesley Jeffries | 255 | 3.5 | -2.4 | |
| Majority | 1,063 | 14.7 | -4.6 | ||
| Turnout | 7,225 | 40.2 | |||
| Conservative hold | Swing | ||||
| Party | Candidate | Votes | % | ± | |
|---|---|---|---|---|---|
| Conservative | Ryan Stephenson | 3,295 | 57.8 | -3.0 | |
| Labour | Leo Verity | 946 | 16.6 | -0.8 | |
| UKIP | Rosemary Marian O'Dea | 706 | 12.4 | +1.4 | |
| Green | David Thomas Corry | 382 | 6.7 | +1.4 | |
| Liberal Democrat | Sara Karen Howell | 371 | 6.5 | +1.0 | |
| Majority | 2,349 | 41.2 | -2.2 | ||
| Turnout | 5,700 | 38.7 | |||
| Conservative hold | Swing | ||||
| Party | Candidate | Votes | % | ± | |
|---|---|---|---|---|---|
| Labour | Al Garthwaite | 1,516 | 50.1 | +10.1 | |
| Green | Joe Angus Salmon | 705 | 23.7 | -7.9 | |
| Liberal Democrat | Penny Goodman | 556 | 18.7 | +6.3 | |
| Conservative | Diane Elaine Fox | 113 | 3.8 | -8.6 | |
| UKIP | Paul William Thomas Denner | 73 | 2.5 | +0.6 | |
| TUSC | Jack Andrew Niddrie | 14 | 0.5 | -0.4 | |
| Majority | 811 | 26.4 | +18.0 | ||
| Turnout | 2,922 | 28.2 | |||
| Labour hold | Swing | ||||
| Party | Candidate | Votes | % | ± | |
|---|---|---|---|---|---|
| Liberal Democrat | Chris Townsley | 2,329 | 32.9 | +13.4 | |
| Labour | Ian McCargo | 1,945 | 27.5 | +3.2 | |
| Conservative | Richard O'Callaghan | 1,923 | 27.2 | -12.9 | |
| UKIP | Roger Tattersall | 462 | 6.5 | -1.8 | |
| Green | Ben Hall | 421 | 5.9 | -1.0 | |
| Majority | 384 | 5.4 | -10.4 | ||
| Turnout | 7,080 | 42.2 | |||
| Liberal Democrat hold | Swing | ||||
| Party | Candidate | Votes | % | ± | |
|---|---|---|---|---|---|
| Labour | Christine Denise Towler | 2,075 | 65.0 | +15.3 | |
| Green | Christopher Mark Foren | 509 | 15.9 | -10.4 | |
| Conservative | Constance Mary Campbell | 215 | 6.7 | -6.6 | |
| UKIP | Joe Murgatroyd | 179 | 5.6 | +1.3 | |
| Liberal Democrat | Ian George Dowling | 163 | 5.1 | ±0 | |
| TUSC | Ben Mayor | 52 | 1.6 | +0.3 | |
| Majority | 1,566 | 49.1 | +25.6 | ||
| Turnout | 3,193 | 23.6 | |||
| Labour hold | Swing | ||||
| Party | Candidate | Votes | % | ± | |
|---|---|---|---|---|---|
| Labour | Graham Hyde | 2,811 | 62.3 | +7.5 | |
| UKIP | Steve Leak | 828 | 18.3 | -5.3 | |
| Conservative | Elizabeth Mary Hayes | 431 | 9.5 | -4.6 | |
| Liberal Democrat | Adam Douglas | 166 | 3.7 | +0.2 | |
| Green | Jaimes Lewis Moran | 124 | 2.7 | -1.3 | |
| Yorkshire First | John Otley | 111 | 2.5 | +2.5 | |
| TUSC | Iain Alaistair Dalton | 44 | 1.0 | +1.0 | |
| Majority | 1983 | 44.0 | +12.8 | ||
| Turnout | 4,515 | 27.8 | |||
| Labour hold | Swing | ||||
| Party | Candidate | Votes | % | ± | |
|---|---|---|---|---|---|
| Labour | Mary Elizabeth Harland | 3,122 | 55.8 | +6.3 | |
| UKIP | Paul Anthony Spivey | 1,138 | 20.3 | +3.3 | |
| Conservative | Ines Newell | 978 | 17.5 | 7.8 | |
| Liberal Democrat | Elizabeth Hindley | 181 | 3.2 | +0.2 | |
| Green | Stephen Paul Terry | 180 | 3.2 | -2.0 | |
| Majority | 1,984 | 35.5 | +11.2 | ||
| Turnout | 5,599 | 35.0 | |||
| Labour hold | Swing | ||||
| Party | Candidate | Votes | % | ± | |
|---|---|---|---|---|---|
| Labour | Lucinda Joy Yeadon | 3,453 | 68.5 | +16.8 | |
| UKIP | Cain Arron Weber | 547 | 10.9 | +0.3 | |
| Green | Morgan Rhys Tatchell-Evans | 420 | 8.3 | -10.0 | |
| Conservative | George William Andrew Rear | 313 | 6.2 | -6.1 | |
| Liberal Democrat | Martin Gareth Hughes | 212 | 4.2 | -1.5 | |
| Independent | Stuart William Long | 53 | 1.1 | +1.1 | |
| TUSC | Maddy Steeds | 43 | 0.9 | -0.5 | |
| Majority | 5,040 | 57.6 | +24.2 | ||
| Turnout | 5041 | 34.5 | |||
| Labour hold | Swing | ||||
| Party | Candidate | Votes | % | ± | |
|---|---|---|---|---|---|
| Labour | Paul Anthony Truswell | 2,285 | 48.9 | -1.3 | |
| UKIP | Craig James Sweaton | 1,278 | 27.4 | -2.7 | |
| Independent | Wayne Alan Dixon | 605 | 13.0 | +13.0 | |
| Conservative | Hugh William Findlay | 300 | 6.4 | -5.9 | |
| Green | Fiona Sarah Heather Love | 104 | 2.2 | -0.7 | |
| Liberal Democrat | Sadie Fisher | 99 | 2.1 | -0.3 | |
| Majority | 1007 | 21.6 | -0.5 | ||
| Turnout | 4,671 | 25.3 | +4.2 | ||
| Labour hold | Swing | ||||
| Party | Candidate | Votes | % | ± | |
|---|---|---|---|---|---|
| Labour | Alex Sobel | 3,517 | 53.5 | +8.8 | |
| Conservative | Mark Samuel Dodsworth | 1,349 | 20.5 | -7.4 | |
| Liberal Democrat | Chris Howley | 692 | 10.5 | +0.6 | |
| UKIP | Harvey C Alexander | 565 | 8.3 | +0.4 | |
| Green | Tim Goodall | 455 | 6.7 | +1.2 | |
| Majority | 2,168 | 33.0 | +16.2 | ||
| Turnout | 6,578 | 38.7 | |||
| Labour hold | Swing | ||||
| Party | Candidate | Votes | % | ± | |
|---|---|---|---|---|---|
| Morley Borough Independent | Robert Finnigan | 2,891 | 50.6 | +13.3 | |
| Labour | Andrew Timothy Scopes | 1,245 | 21.8 | -0.1 | |
| Conservative | Jason Karl Aldiss | 816 | 14.3 | -7.5 | |
| UKIP | Peter Morgan | 537 | 9.4 | +3.6 | |
| Green | Mickayla Ireland | 122 | 2.1 | -1.0 | |
| Liberal Democrat | Peter Richard Andrews | 108 | 1.9 | -0.4 | |
| Majority | 1,646 | 28.8 | +13.4 | ||
| Turnout | 5,719 | 32.8 | |||
| Morley Borough Independent hold | Swing | ||||
| Party | Candidate | Votes | % | ± | |
|---|---|---|---|---|---|
| Morley Borough Independent | Judith Mary Elliott | 2,188 | 43.2 | +18.0 | |
| Labour | Sarah Samantha Jane Keig | 1,445 | 28.5 | +2.0 | |
| UKIP | David Michael Kent | 687 | 13.6 | -3.3 | |
| Conservative | Jane Eastwood | 547 | 10.8 | +10.0 | |
| Green | Christopher James Bell | 145 | 2.9 | -0.8 | |
| Liberal Democrat | Aqila Choudhry | 55 | 1.1 | -0.9 | |
| Majority | 743 | 14.7 | +9.3 | ||
| Turnout | 5.067 | 30.8 | |||
| Morley Borough Independents gain from Labour | Swing | ||||
| Party | Candidate | Votes | % | ± | |
|---|---|---|---|---|---|
| Liberal Democrat | Sandy Lay | 3,737 | 48.1 | +12.6 | |
| Labour | Nik Rutherford | 1,825 | 23.5 | -2.6 | |
| Conservative | Jonathon David Taylor | 702 | 9.0 | -9.0 | |
| UKIP | Tom Hollings | 675 | 8.7 | -2.7 | |
| Green | Mick Bradley | 501 | 6.5 | -2.5 | |
| Independent | Jackie Brown | 323 | 4.1 | +4.1 | |
| Majority | 1,912 | 24.6 | +15.2 | ||
| Turnout | 7,763 | 45.1 | |||
| Liberal Democrat hold | Swing | ||||
| Party | Candidate | Votes | % | ± | |
|---|---|---|---|---|---|
| Labour | Josie Jarosz | 2,884 | 45.4 | +3.8 | |
| Conservative | Simon Anthony Seary | 2,120 | 33.3 | -2.6 | |
| UKIP | Kath Tattersall | 751 | 11.8 | -1.8 | |
| Green | Laura Rosemary Johnson | 220 | 3.5 | -1.8 | |
| Yorkshire First | Conor Andrew O'Neill | 211 | 3.3 | +3.3 | |
| Liberal Democrat | Jude Patrick Arbuckle | 167 | 2.6 | -0.4 | |
| Majority | 764 | 12.3 | +6.7 | ||
| Turnout | 6,353 | 36.9 | |||
| Labour hold | Swing | ||||
| Party | Candidate | Votes | % | ± | |
|---|---|---|---|---|---|
| Labour | David Patrick Nagle | 2,026 | 36.1 | -2.5 | |
| Liberal Democrat | Carmel Francess Harrison | 1728 | 30.1 | +10.5 | |
| Conservative | Steve Ellis | 912 | 16.2 | -8.7 | |
| UKIP | David Daniel | 750 | 13.3 | ±0 | |
| Green | Emma Dobson | 203 | 3.6 | -0.1 | |
| Majority | 298 | 6.0 | -7.7 | ||
| Turnout | 5,619 | 36.4 | |||
| Labour hold | Swing | ||||
| Party | Candidate | Votes | % | ± | |
|---|---|---|---|---|---|
| Labour | Eleanor Judith Tunnicliffe | 4,161 | 57.7 | +8.1 | |
| Conservative | Michael Lowry | 1,584 | 22.0 | -6.1 | |
| Green | Paul Charles Ellis | 461 | 6.4 | +1.8 | |
| Liberal Democrat | Najeeb Iqbal | 417 | 5.8 | +0.2 | |
| UKIP | Steven Leslie Benjamin Bell | 395 | 5.5 | +0.7 | |
| Alliance for Green Socialism | Malcolm Scott Christie | 196 | 2.7 | +0.5 | |
| Majority | 2,577 | 35.7 | +14.3 | ||
| Turnout | 7,214 | 41.8 | |||
| Labour hold | Swing | ||||
| Party | Candidate | Votes | % | ± | |
|---|---|---|---|---|---|
| Labour | Debra Coupar | 2,690 | 46.6 | +3.7 | |
| Conservative | David Schofield | 1,430 | 24.8 | -4.4 | |
| UKIP | Phil Moore | 1,259 | 21.8 | +1.8 | |
| Liberal Democrat | Keith Cecil Norman | 216 | 3.7 | -0.3 | |
| Green | Sarah Ann Crossland | 179 | 3.1 | -0.7 | |
| Majority | 1,260 | 21.8 | +8.1 | ||
| Turnout | 5,774 | 36.0 | |||
| Labour hold | Swing | ||||
| Party | Candidate | Votes | % | ± | |
|---|---|---|---|---|---|
| Liberal Democrat | Jonathan Joseph Bentley | 2,701 | 44.3 | +9.0 | |
| Labour | Roger Harington | 1,982 | 32.5 | +5.5 | |
| Conservative | Angelo Basu | 597 | 9.8 | ||
| Green | Martin Francis Hemingway | 415 | 6.8 | -6.9 | |
| UKIP | Mike Cullen | 398 | 6.5 | -1.0 | |
| Majority | 719 | 11.8 | +3.5 | ||
| Turnout | 6,093 | 41.3 | |||
| Liberal Democrat hold | Swing | ||||
| Party | Candidate | Votes | % | ± | |
|---|---|---|---|---|---|
| Conservative | Gerald Wilkinson | 3,387 | 58.3 | -0.1 | |
| Labour | Adam Ferhani | 1,141 | 19.6 | -1.6 | |
| UKIP | Tina Janette Smith | 712 | 12.3 | +3.2 | |
| Liberal Democrat | Christine Mavis Golton | 366 | 6.3 | +0.3 | |
| Green | Vasco Santos | 203 | 3.5 | -1.8 | |
| Majority | 2,246 | 38.7 | +1.6 | ||
| Turnout | 5,809 | 37.5 | |||
| Conservative hold | Swing | ||||
References
- ↑ "Leeds City Council Election". Leeds City Council. Retrieved 8 April 2016.
- 1 2 "Election results - Local 2016". Leeds City Council. Retrieved 28 November 2016.
- ↑ "Local election results 2016: Leeds". Yorkshire Post. 6 May 2016.
| City of Bradford Metropolitan District Council | |
|---|---|
| Calderdale Metropolitan Borough Council | |
| Kirklees Metropolitan Borough Council | |
| Leeds City Council | |
| Wakefield Metropolitan District Council | |
| West Yorkshire County Council | |
| West Riding County Council | |
| |
This article is issued from Wikipedia - version of the 11/28/2016. The text is available under the Creative Commons Attribution/Share Alike but additional terms may apply for the media files.